

Sofia Mattson — Researcher & Designer

RESEARCHER & DESIGNER · HEALTH · EMERGING TECHNOLOGY

Research and design strategist for emerging technology and wellbeing.

I'm Sofia Mattson. I hold an M.S. in Human-Environment Relations from Cornell University, after a B.S. in Psychology with Honors with Distinction and post-baccalaureate work in neuroscience and clinical research. I study how people experience hospitals, workplaces, public spaces, and their virtual counterparts, then turn that evidence into design and strategy. I'm looking for teams, from product and strategy groups to consultancies and think tanks, where human experience shapes how we innovate.

More about me →

img_1349

Work

{{ countLabel }}
Domain
Medium
  1. {{ p.num }} {{ p.title }} {{ p.domains }} / {{ p.media }}

No projects match both filters.

About

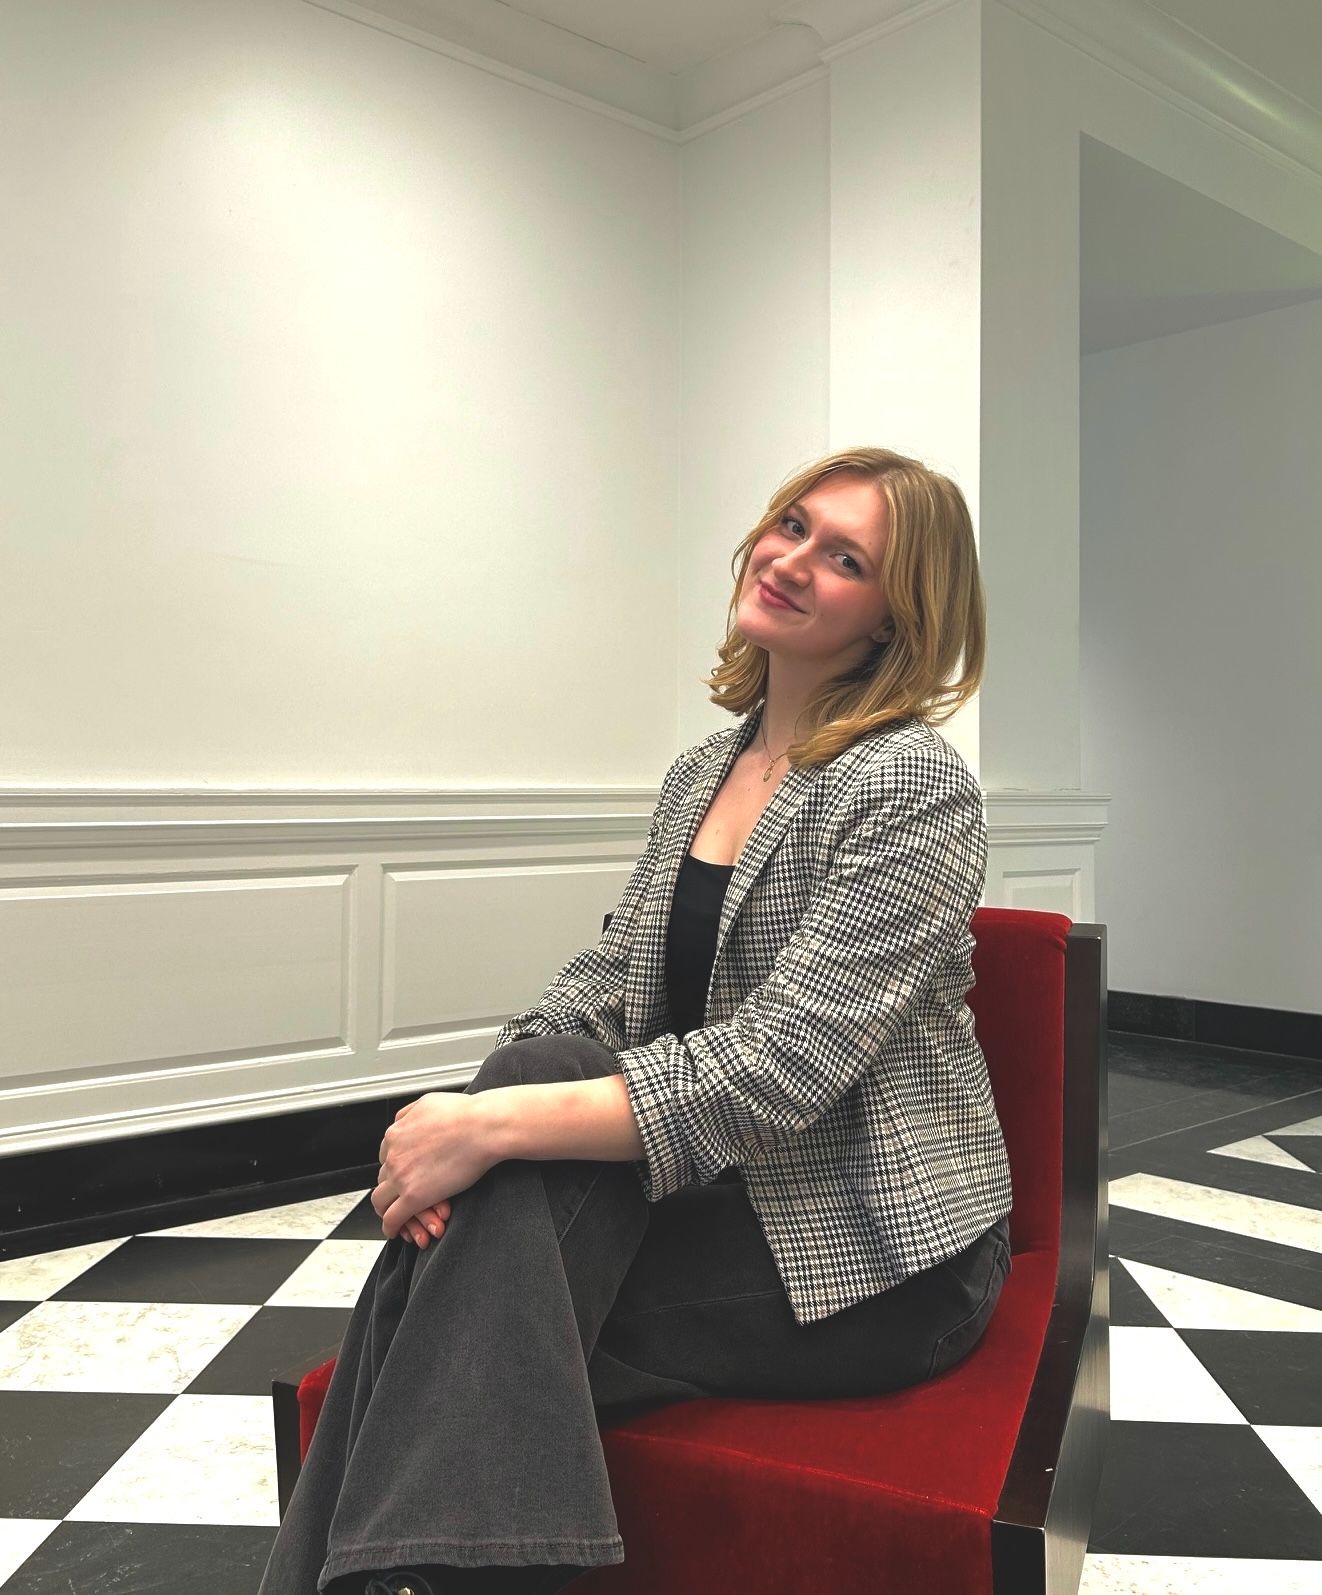
Portrait of Sofia Mattson

Download CV

Teaching & Service

  • Teaching Assistant
    DEA 1112 Change-making: Designing Healthy and Hospitable Environments, Cornell
  • Student Administrative Assistant
    Cornell Institute for Healthy Futures — event marketing, website management, and relationships with industry and academic scholars
  • Wellness Fellow
    Graduate and Professional Student Center, in partnership with the Nature Rx program
  • Early Childhood Music Educator
    Wisconsin Conservatory of Music

Selected Recognition

  • 2nd Prize
    Cornell Human-Centered Design Research Poster Contest, 2025
  • Exhibitor
    Cornell College of Human Ecology Fashion & Design Expo, 2025
  • Senior Excellence in Research Award
    University of Wisconsin–Milwaukee, 2020–21
  • Phi Beta Kappa
    Elected 2021; B.S. summa cum laude, Honors with Distinction

Sofia E Mattson
M.S. Human-Environment Relations
College of Human Ecology, Cornell University

I hold an M.S. in Human-Environment Relations from Cornell’s Department of Human Centered Design, after a B.S. in Psychology. Before Cornell, I spent four years in affective neuroscience labs studying how threat affects working memory, where I co-authored two published articles. I then spent two years on the Adolescent Brain Cognitive Development (ABCD) study running psychiatric interviews, neuropsychological testing, and multimodal MRI. I also worked as a certified early childhood music teacher, focused on cognitive development.

That background is why I value evidence-based decisions, critical approaches to data and design, and the full range and depth of human experience. It also shapes what I choose to work on: hospitals, workplaces, classrooms, and their virtual counterparts, improving the infrastructure, workflows, and daily lives within them.

To me, future-oriented human-centered design follows the structure of design thinking without losing sight of a broader, more nuanced humanity.

My curiosity and lateral thinking come from music. I’m a classically trained harpist of twenty years, as well as a violist and singer. I’ve performed with symphonies, earned awards for harp performance, composed my own music, and improvise with other artists, like a set with a dancer at the Museum of Wisconsin Art, or with a Chicago rap artist at Pilsen Fest. Before graduate school, I started a podcast, set to my own meandering harp soundscape, that traced findings in neuroscience and environmental psychology back to folklore and processes in the natural world. That pull between art and science drives my own creative academic work, like my panel presentation on tech-nature mimesis and digital landscapes in climate literature at MLA 2026 in Toronto.

← Back to all work

{{ cur.num }} · {{ cur.course }} · {{ cur.context }}

{{ cur.title }}

{{ cur.link.label }}

{{ f.k }}
{{ f.v }}
AI components
  • {{ a.name }} · {{ a.status }}
Principles
  • {{ pr }}

[CONFIRM] {{ cur.confirm }}

Without data center drone

Ithaca Falls, recorded on site — native eastern spring birdsong layered in from the Macaulay Library.

With data center drone

Identical recording, with a synthesized server drone underneath (dark band). 

Study design: the same Ithaca Falls recording heard in two conditions, without and with a synthesized data-center drone.
{{ gCounter }}
  • {{ g.cap }}
{{ cur.video.cap }}

01

The Challenge

As more healthcare organizations adopt AI architecture into existing EHR systems, one of the leading causes of post-launch failure is undetected model drift.

Our client, KP, already had the vision for community integration through technology from their Project RAD’s Health Hub, but nothing connected clinical data, lifestyle, local resources and population trends. Physicians and members were filling that gap with unregulated tools like ChatGPT and Doximity.

As we presented to Kasier's Architectural and Tech Innovation team, we wanted AI to make facility investment measurable, and in turn, the facility design makes the AI useful via predictive modeling given member and physician context.


02

Key Decisions

i. We chose an on-premise, data-centric model over a cloud, model-centric one

ii. Physician-in-the-loop AI chat bot within KP's member app that suggests local and personally tailored self-care management tips based on diagnosis, wearable data, and chat input

iii. We made governance a 90-second micro-task between encounters, not a parallel administrative job

03

System design

System flow. One member check-in becomes a facility decision with a measured ROI; each visit improves the model.
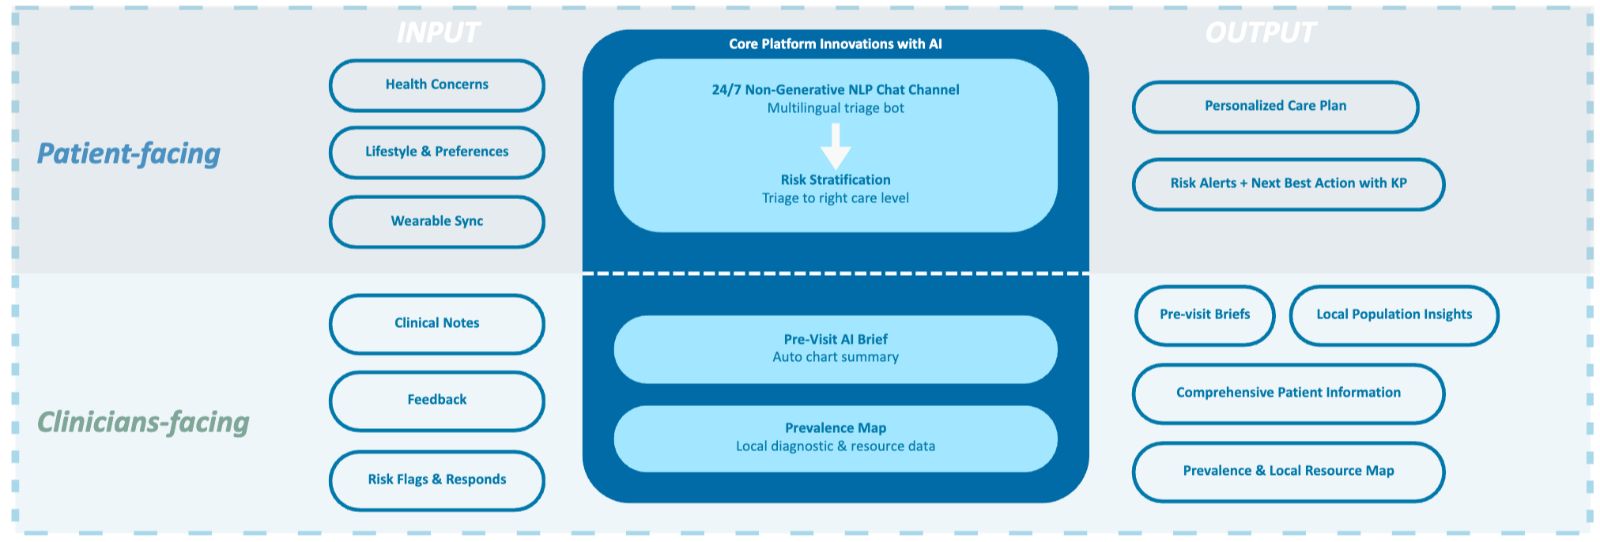
Solution A architecture. Patient-facing inputs (health concerns, lifestyle, wearables) and clinician-facing inputs (notes, feedback, risk flags) feed a 24/7 non-generative chat channel, pre-visit briefs, and a prevalence map. The safeguard: no generative responses about diagnoses; those questions go to a pharmacist or doctor.

04

Outcome

A three-year phased rollout with calculated risks for missed milestones. Doctors' new role of governing AI output warrants physical infrastructure to support the human side of this necessary task. The governance space is designed to complement the on-premise, data-centric model; providing evidence-based design suggestions for maximum physician comfort and convenience reinforces strong data. 

8–10 min

Clinician time reclaimed per visit, from the pre-visit AI brief plus a 90-second governance check.

$8M

Capital at risk if model drift goes undetected — the cost the space exists to prevent. Amenity ROI is made visible.

90 sec

Timed review per AI output: amber at 75 seconds, then approve, override, escalate, or defer.
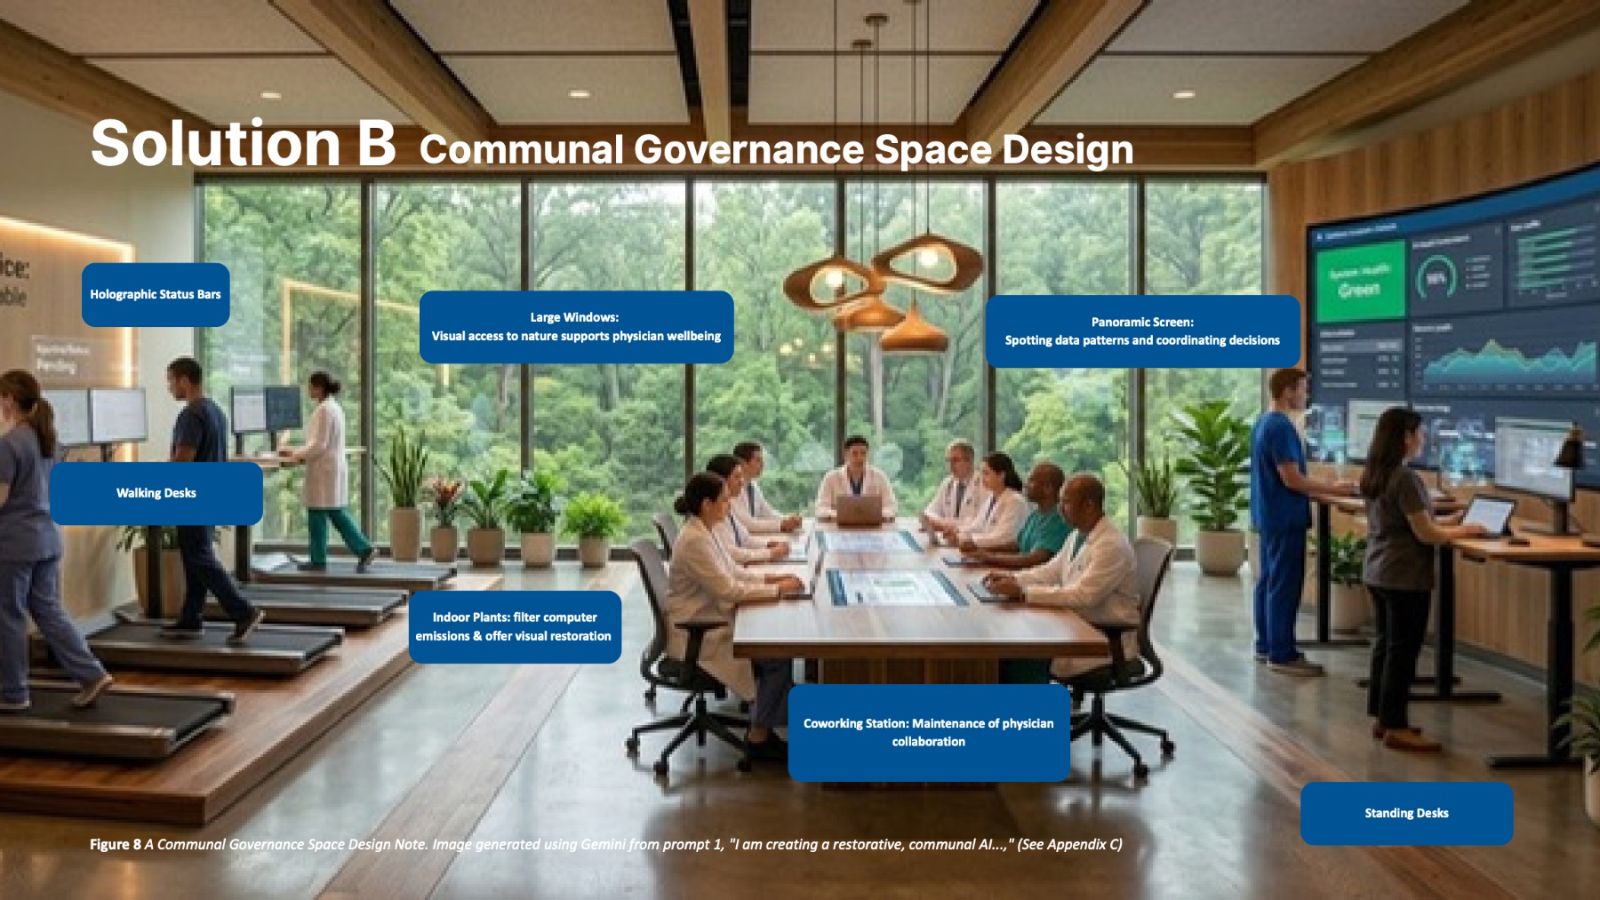
Restorative Communal Governance Space: walking desks, panoramic screen, indoor plants, window views
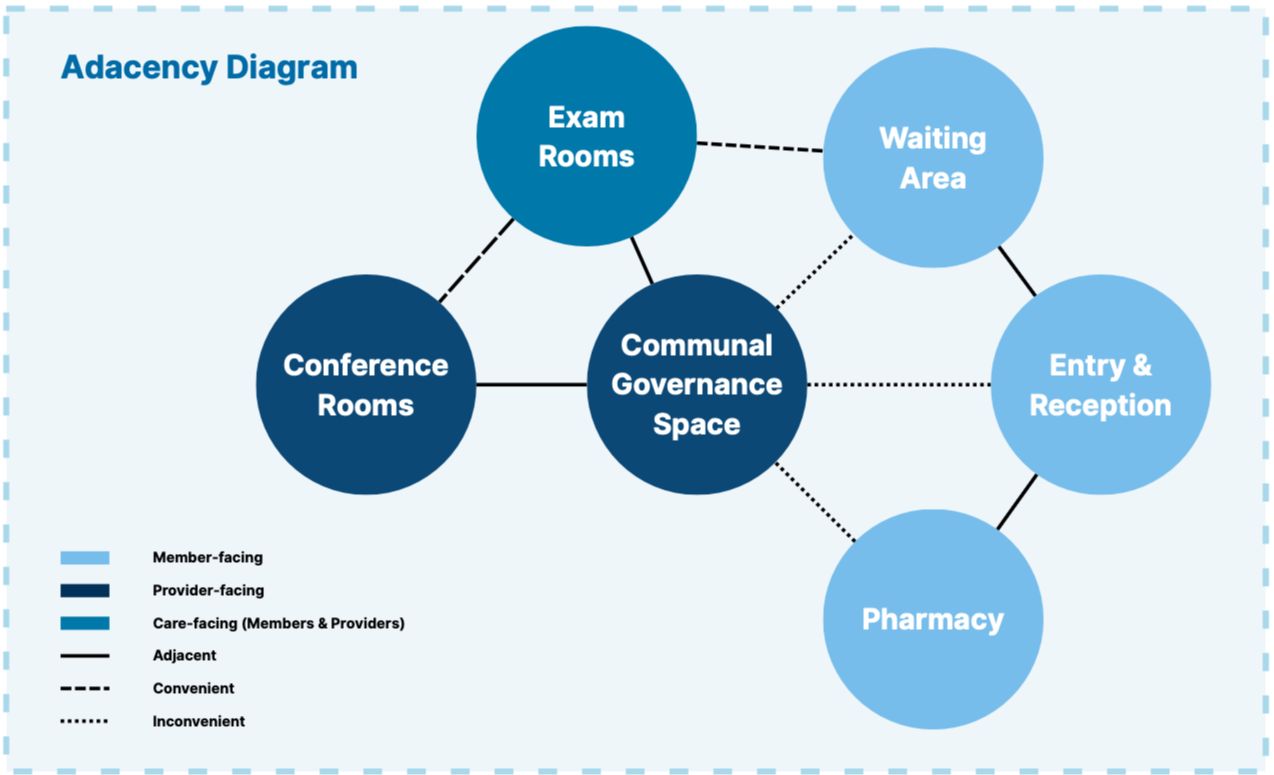
The Restorative Communal Governance Space — provider-only, keycard-locked, sited between exam rooms and conference rooms. Walking desks, hardware-fume-filtering plants, and window views alleviate the increased screen-time that AI oversight adds to the day.
Adjacency diagram. The governance space is central to the provider-facing group: adjacent to conference rooms and exam rooms, and deliberately inconvenient to waiting, reception, and pharmacy.

The problem

Older adults want to age in place, but the digital platforms and physical third places that could keep them connected remain siloed.

What we made

A community app that uses the digital platform purely to activate real-world connection, routing neighbors with shared interests and routines to certified age-friendly venues.

My role

App developer and UX designer. Recruited and interviewed focus-group participants, researched the age-friendly business audit tool, and edited the script, voiceover, and audio for the promotional video.

01 · Problem

"It's very difficult when you're older to meet people."Usability focus group participant

Social isolation carries a 29% increase in mortality risk, with effects comparable in magnitude to smoking or physical inactivity. 75% of US adults over 50 want to age in place, yet feel their community infrastructure is not equipped for it.

Physical third places are disappearing and carry access barriers rooted in mobility, socioeconomic inequality, and cultural exclusion. Digital platforms expand reach but risk substituting shallow engagement for genuine relationships. Neither, on its own, sustains recurring community connection.

Primary users: older adults aging in place. Constraint: public spaces and businesses must remain usable throughout the lifespan, so members can maintain and form connections in spaces younger people also occupy.

02 · Research

Opportunity: strengthen neighborhood ties across ages and abilities by connecting who you can meet with where you can comfortably meet.

We analyzed competing platforms, then ran two remote needs-assessment focus groups: four participants each, older adults aged 64–84 and younger adults aged 26–27. Each 90-minute session covered ten to twelve questions across six themes; transcripts were coded in ATLAS.ti for thematic analysis.

Nextdoor

Broadcasts to a neighborhood; builds no relationships.

Wyzr

Borrows dating-app swipe logic for friendship.

Wheelmap

Catalogues accessible venues, with no social layer.

Figure 2. Needs-assessment focus groups: (a) barriers in social interaction and connectedness; (b) technology usage and attitude toward digital platforms.

Findings that converged across both groups

  • In-person connection preferred over digital; smartphones named as disruptive to face-to-face presence.
  • A local third place for casual, regular encounters, particularly in suburban areas where intermediate community spaces are sparse.
  • One-on-one or small-group interactions preferred over larger gatherings.
  • Shared interests, including hobbies, food, and music, as the most reliable bridge across age and individual differences.
  • Technology as a supportive scaffold for sustaining relationships, not the primary site of new connection.

03 · Define & iterate

Four shifts redirected the design, each driven by primary user research or deliberate strategic reframing.

  1. We assumed

    The app would be where new connections form.

    We learned · Needs assessment

    Both age groups preferred in-person connection and framed technology as a scaffold for relationships, not the site of them.

    SOLUTION
    Made it physical-first: the digital platform exists to activate real-world connection

  2. We assumed

    An intergenerational one-on-one platform, working name ConnectGen, would serve everyone.

    SOLUTION
    Centered older adults as primary users, supporting both peer and intergenerational connection

    We learned · Walkthrough testing

    An intergenerational-only framing made some older participants uncomfortable; several preferred same-age peers. Older-adult isolation is also the more concentrated problem, and everyone ages.

  3. We assumed

    A dedicated new third place, designed alongside the app.

    SOLUTION
    Consolidated around the app, identifying existing age-friendly venues as meetup locations

    We learned · Internal critique

    A new venue risked redundancy with existing venues and diluted focus across two design tracks.

  4. We assumed

    One-on-one matching, modeled loosely on dating apps.

    SOLUTION

    Made small groups of at least four members the default matching unit

    We learned · Older-adult and expert walkthroughs

    One-on-one matching introduced motive ambiguity and safety concerns: "It feels a little bit like a date." Group events relieved most of them.

A high-fidelity, mobile-first interactive prototype built in Figma Make across five iterations, with technical specifications written as prompts to Claude. The UX centers on three actionable mechanisms to bridge digital relationships into real life: physical co-presence, recurrence, and shared memory.

Figure 5. Conceptual model of the kinfolk prototype.
Figure 4. Input-output and data flow across kinfolk’s interactive scenarios. Developed by the authors, assisted by a generative AI tool.

Account · Members

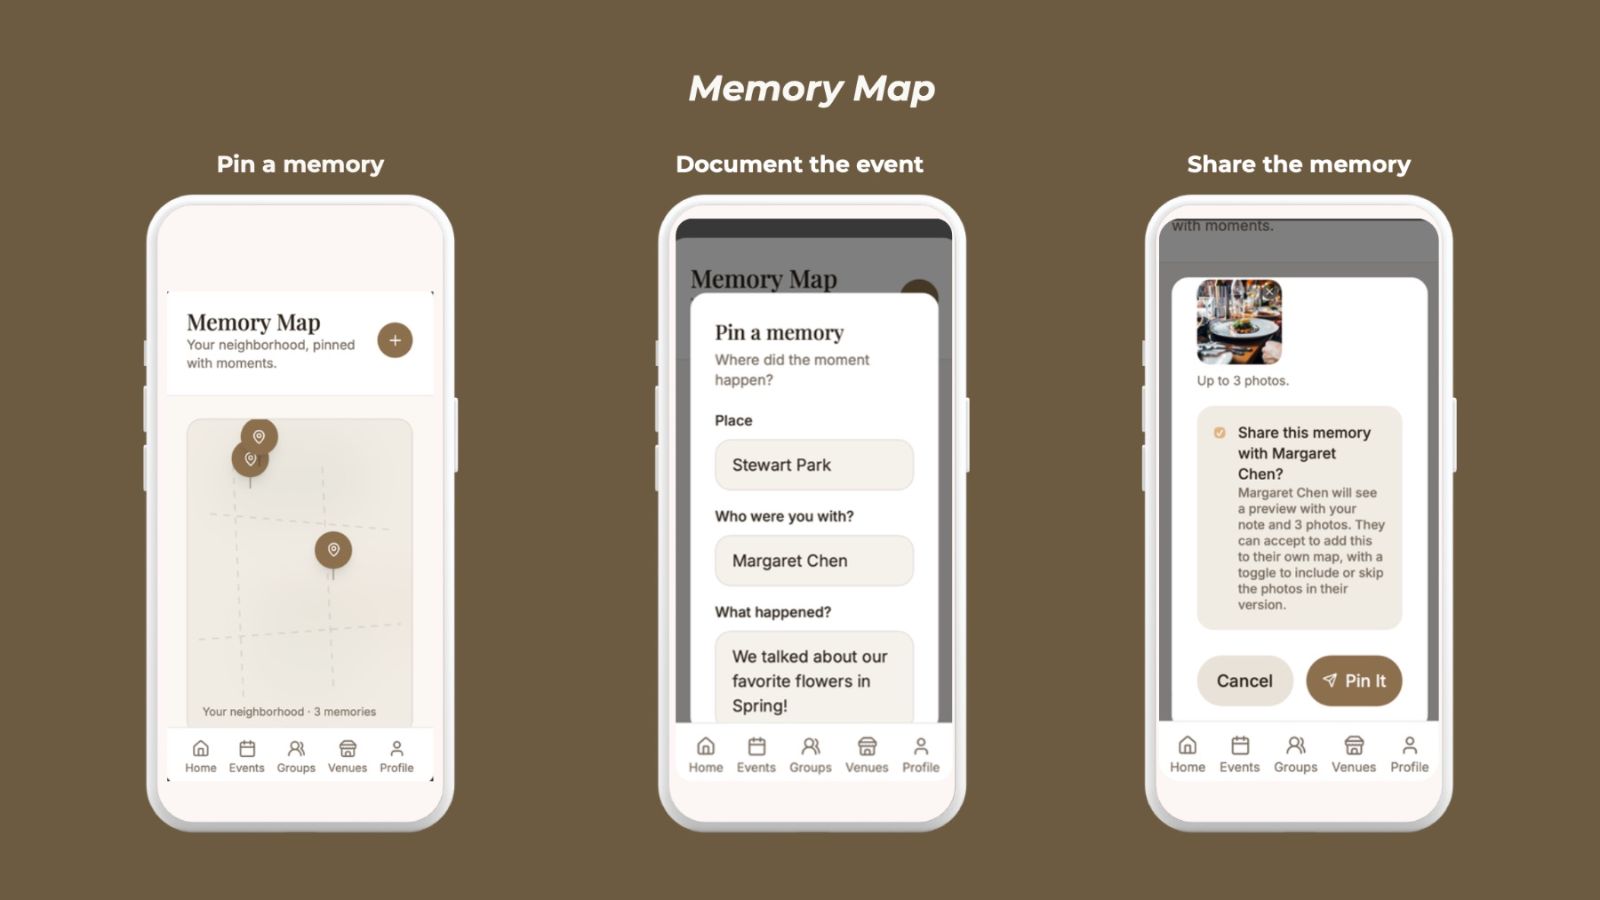
Onboarding, interests and routines, optional accessibility preferences, Memory Map.

Account · Local businesses

Self-audit across eight categories, adapted from the Tompkins County Office for the Aging's Age-Friendly Business Audit Tool.

Account · Community organizations

Post events and volunteer opportunities; anonymized attendance panel for grant reporting.

Decisions in the interface

  • Plain-language match reasoning replaced numeric compatibility scores: "you both walk in Stewart Park on Monday mornings."
  • Accessibility preferences across six domains (mobility, hearing, vision, transit, sensory, free text) rank venues as soft defaults rather than hard filters. For pairs, the system uses the union of both members' needs without showing either member's to the other.
  • Minimum 16pt body type, generous spacing, and a swipeable demo walkthrough after onboarding, replayable from settings.

Iteration log

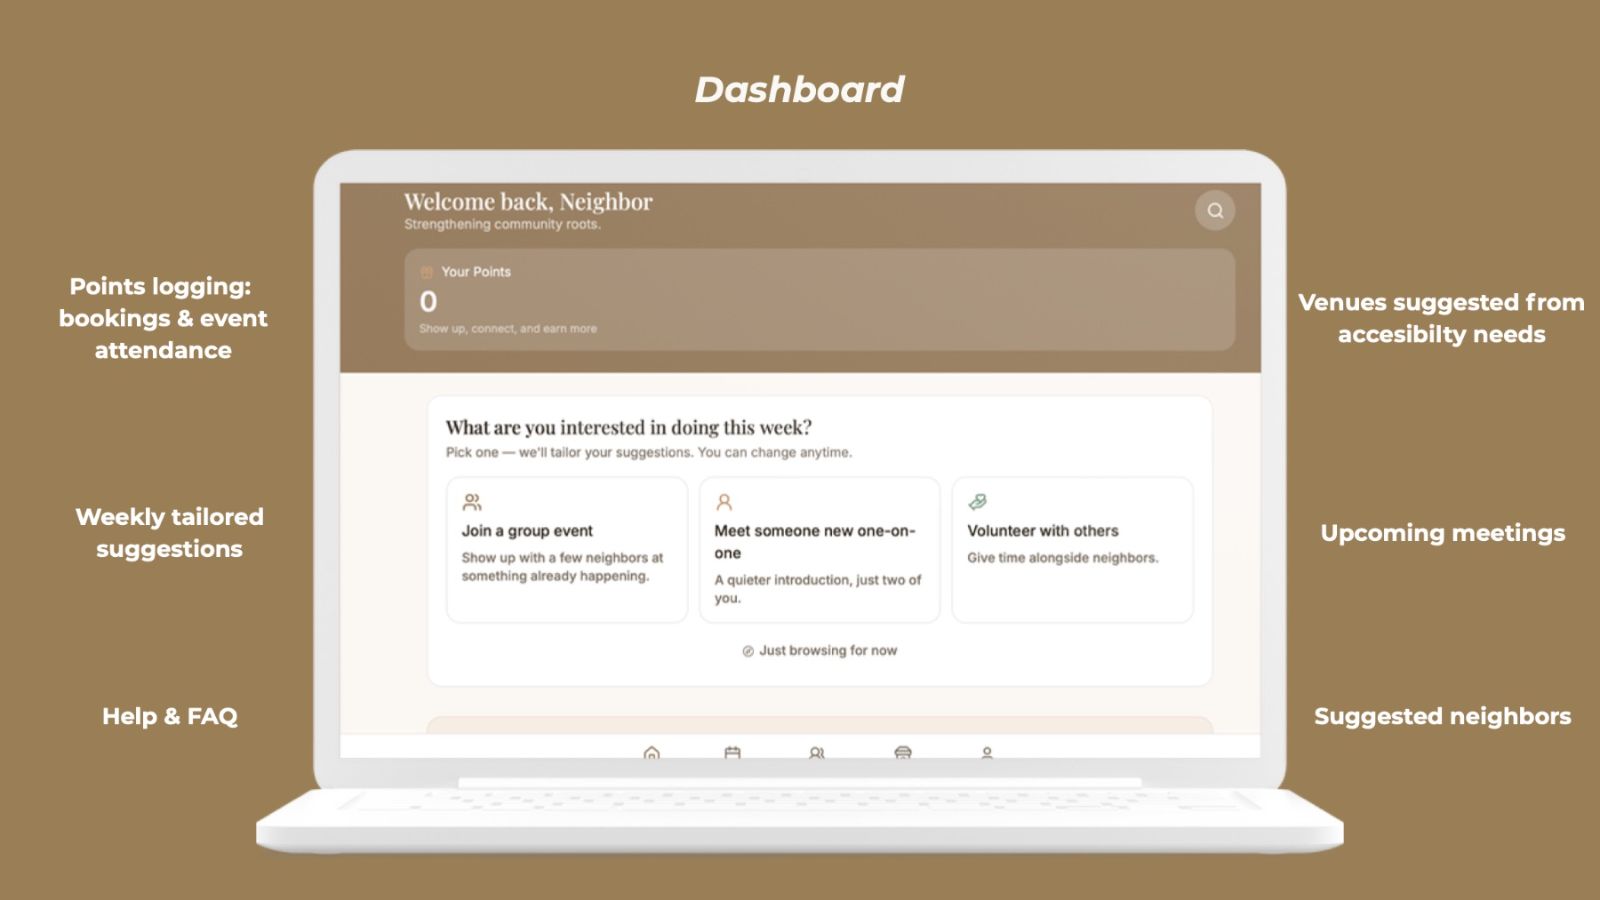
  1. v1ConnectGen: intergenerational one-on-one matching, five-step onboarding, event calendar, points rewards.
  2. v2Renamed kinfolk. Matching on shared rhythms and life experiences, textual match reasoning, Memory Map, business self-audit and certified badge.
  3. v3Help and FAQ; accessibility-aware venue recommendations.
  4. v4Restructured around the weekly intent check-in after the usability focus group. Group events became the flagship flow; community organization accounts added; interests expanded to a categorized library.
  5. v5Logotype, privacy-protective member counts, photo consent for shared memories, lock-screen notification with inline RSVP.
Figure 3. Original data flow design and profile interface ideation, before the first iteration.

05 · Test

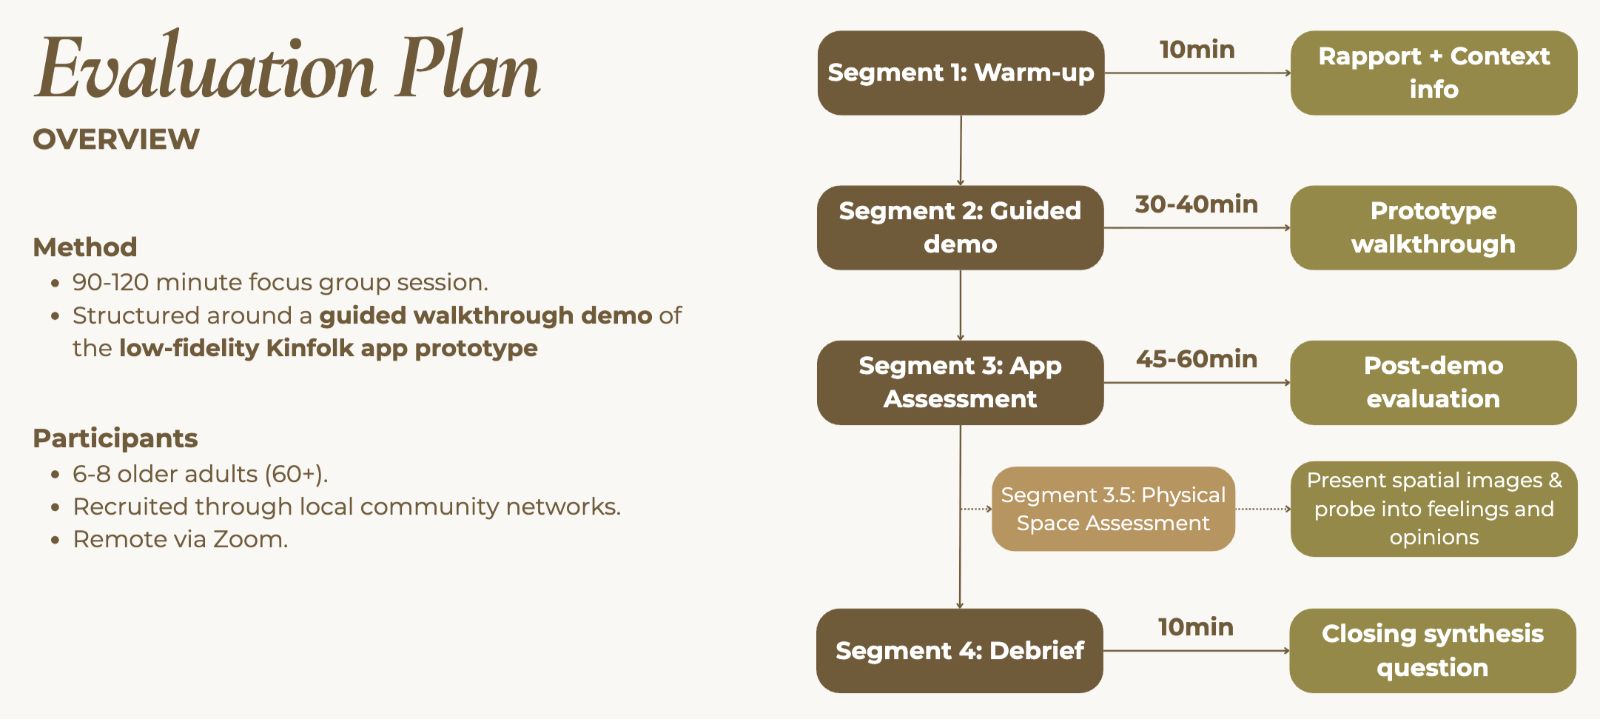
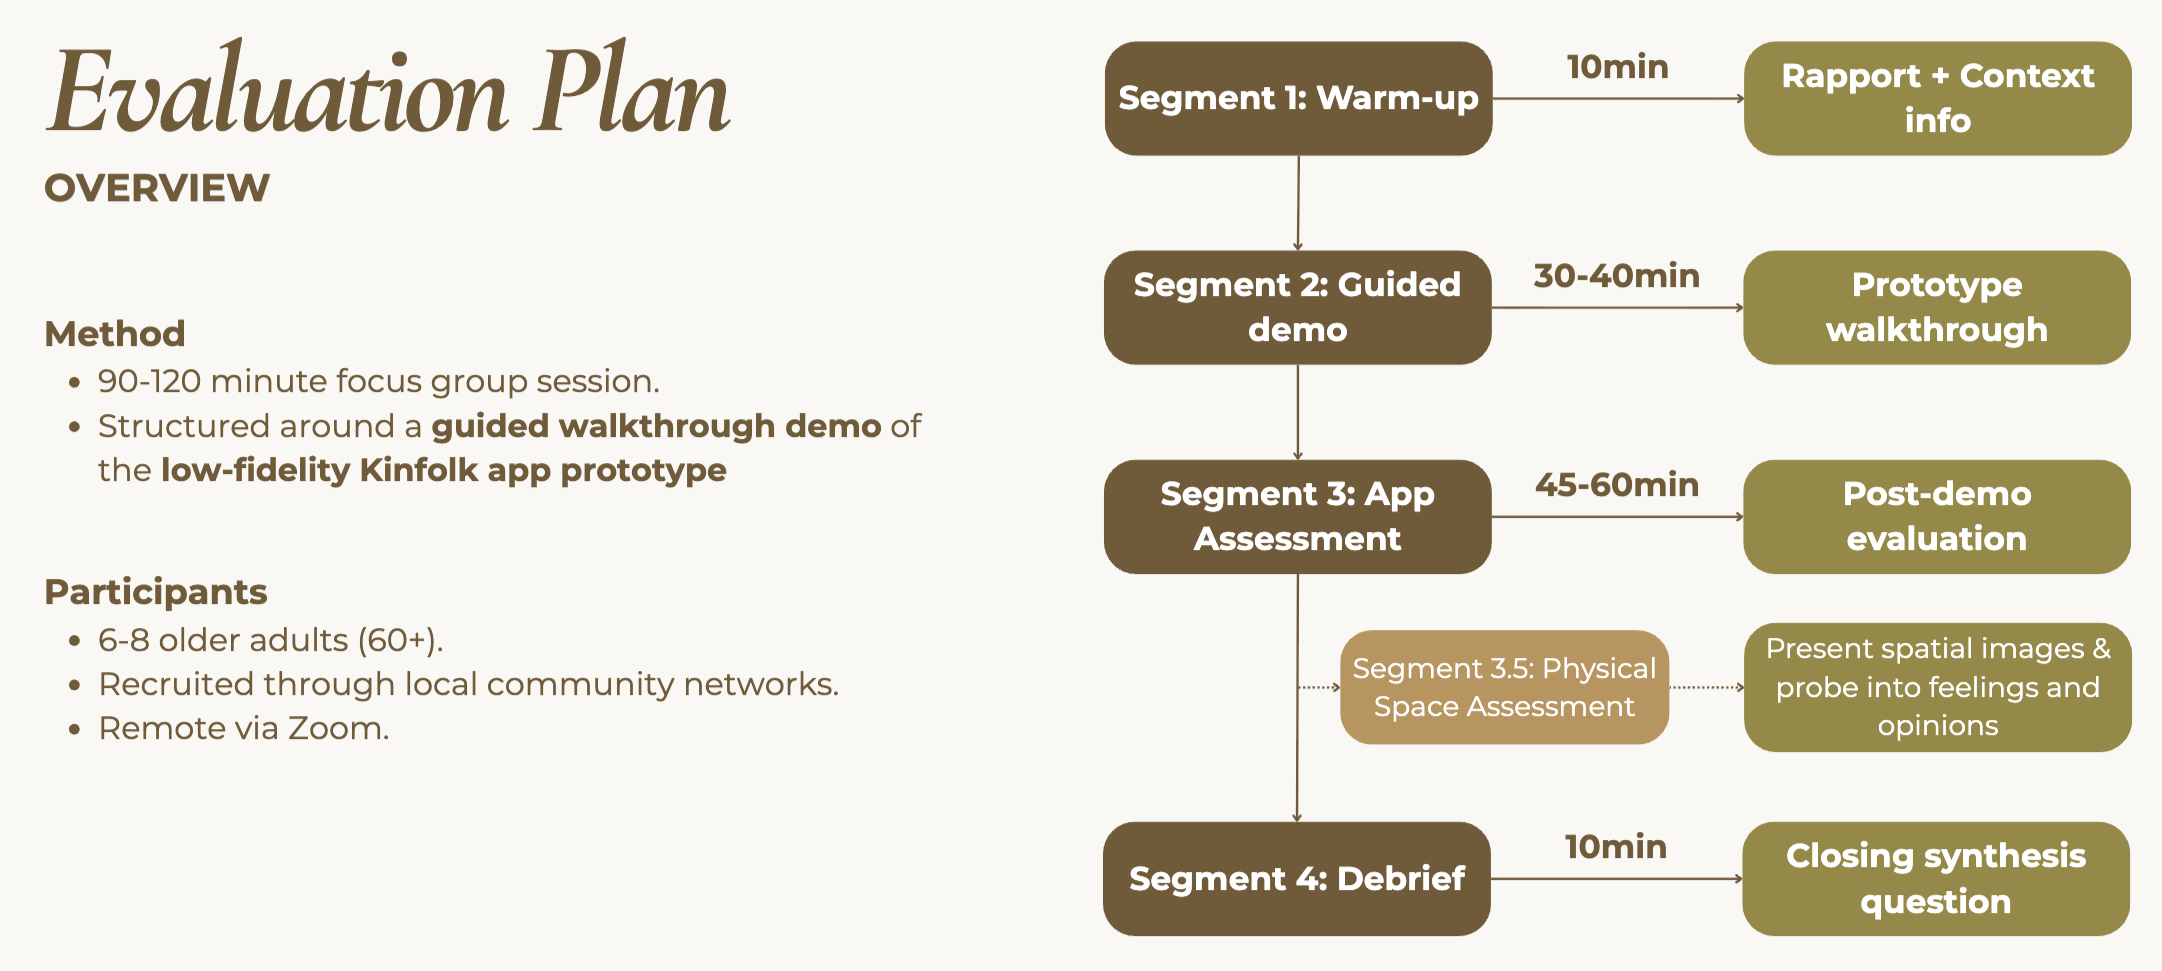
A single 90-minute, moderated, semi-structured virtual focus group with eight older adults (mean age 76, range 71–82; four women, four men; California, Florida, Illinois, New York). Part one covered physical environmental facilitators and barriers to socialization; part two walked through the prototype. An optional anonymous follow-up survey measured the System Usability Scale (SUS).

Figure 6. Testing framework for the kinfolk prototype.

73.5

SUS score (Good), range 60–82.5

8

Older adults, four states

5

Environmental themes for socialization

ThemeFacilitatorBarrier
Physical accessibilityProximity to routine locationsLack of transportation
NoiseQuietLoud
SeatingComfortable seating availableLack of seating
Look and feelArt, good lighting, outdoor settingsInstitutional or impersonal feel
Social environmentKind employeesOthering
FeatureTaskAttitudeKey takeawayQuotes
Profile generationSelection of social preferencesPositiveInterested in intergenerational friendships“I like that, ‘open to intergenerational friendship’, it’s cool.”
Profile generationCompleting profilePositiveFound profile generation easy“Very user-friendly”
Social pairing1-on-1 matchingNegativeConcerned for safety and comfort; desire more verification or social credit“It feels a little bit like a date.” “…this would not feel safe.”
Age-friendly eventsAttending eventsPositiveRelieves most safety concerns; feels like a better environment to meet new people“…that would be a better way to meet individual people, you know, in a group setting, and people would be more comfortable…”
Age-friendly eventsContinued engagement after eventPositiveCould allow growth of 1-on-1 friendships“…going to an event and seeing somebody and chatting with them, and then finding them on the app, and inviting them for coffee.”
Memory MapPutting down pinsMixedSome feel too high technological reliance; others feel it could be helpful for memory“I don’t think my friends would really use this…” “A map might be helpful for something that you really don’t have good clear memory…”
NotificationsMeetup notificationPositiveFelt notifications could be useful and would consider attending; maybe burdensome if DM“Yeah, it sounds more comfortable [than a DM]”
Table 3. Older adult perceptions and attitudes toward platform features.

This feedback drove the fourth iteration: the weekly intent check-in, with group events as the flagship flow.

06 · Next

What "age-friendly" should mean

Matching depends on venues members trust. A nationally disseminated modified Delphi survey, based on accepted age-friendly design concepts, is building consensus among older adults on what belongs in an age-friendly checklist.

Open questions

  • Verification governance. Who decides what counts as a verified community group, on what criteria, and with what recourse for groups that are denied.
  • Privacy asymmetry. Accessibility preferences stay internal, which means the system makes inferences members cannot see.
  • In-person safety. Mitigating perceived and real risk for socially isolated older adults meeting new people.

01

The Challenge

People bring their most personal questions to AI systems that answer with the fluency of an oracle and none of the accountability of a clinician. The combination of human vulnerability to self-labeling and computational (in)capabilities of instant data processing potentially create escalating dependencies rather than providing insights or genuine healing.

02

Key Decisions

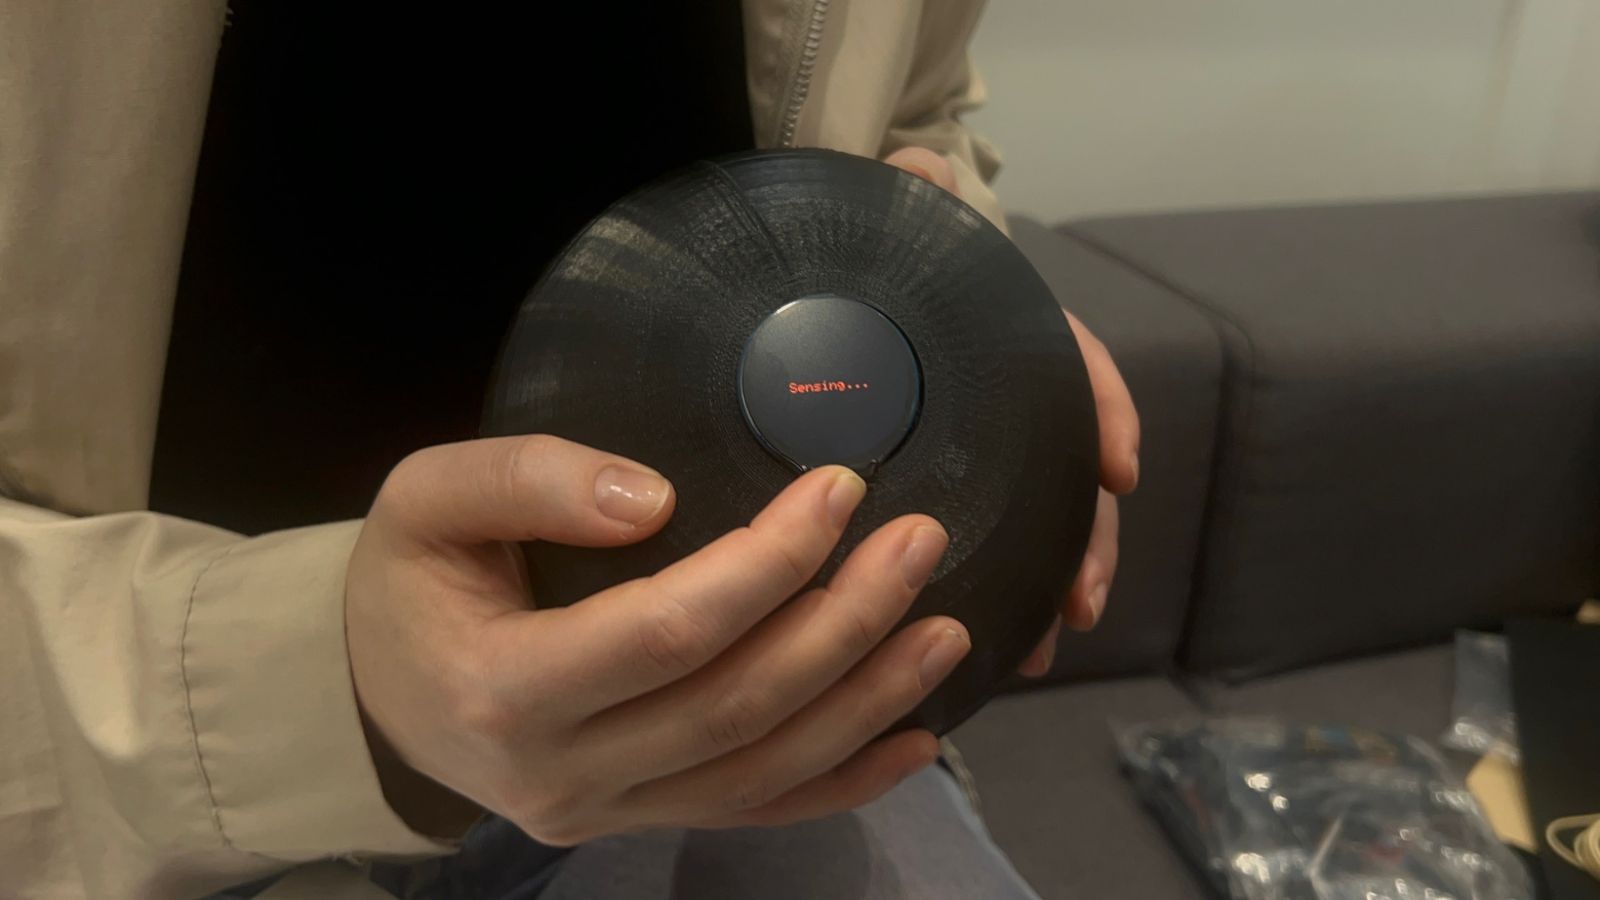
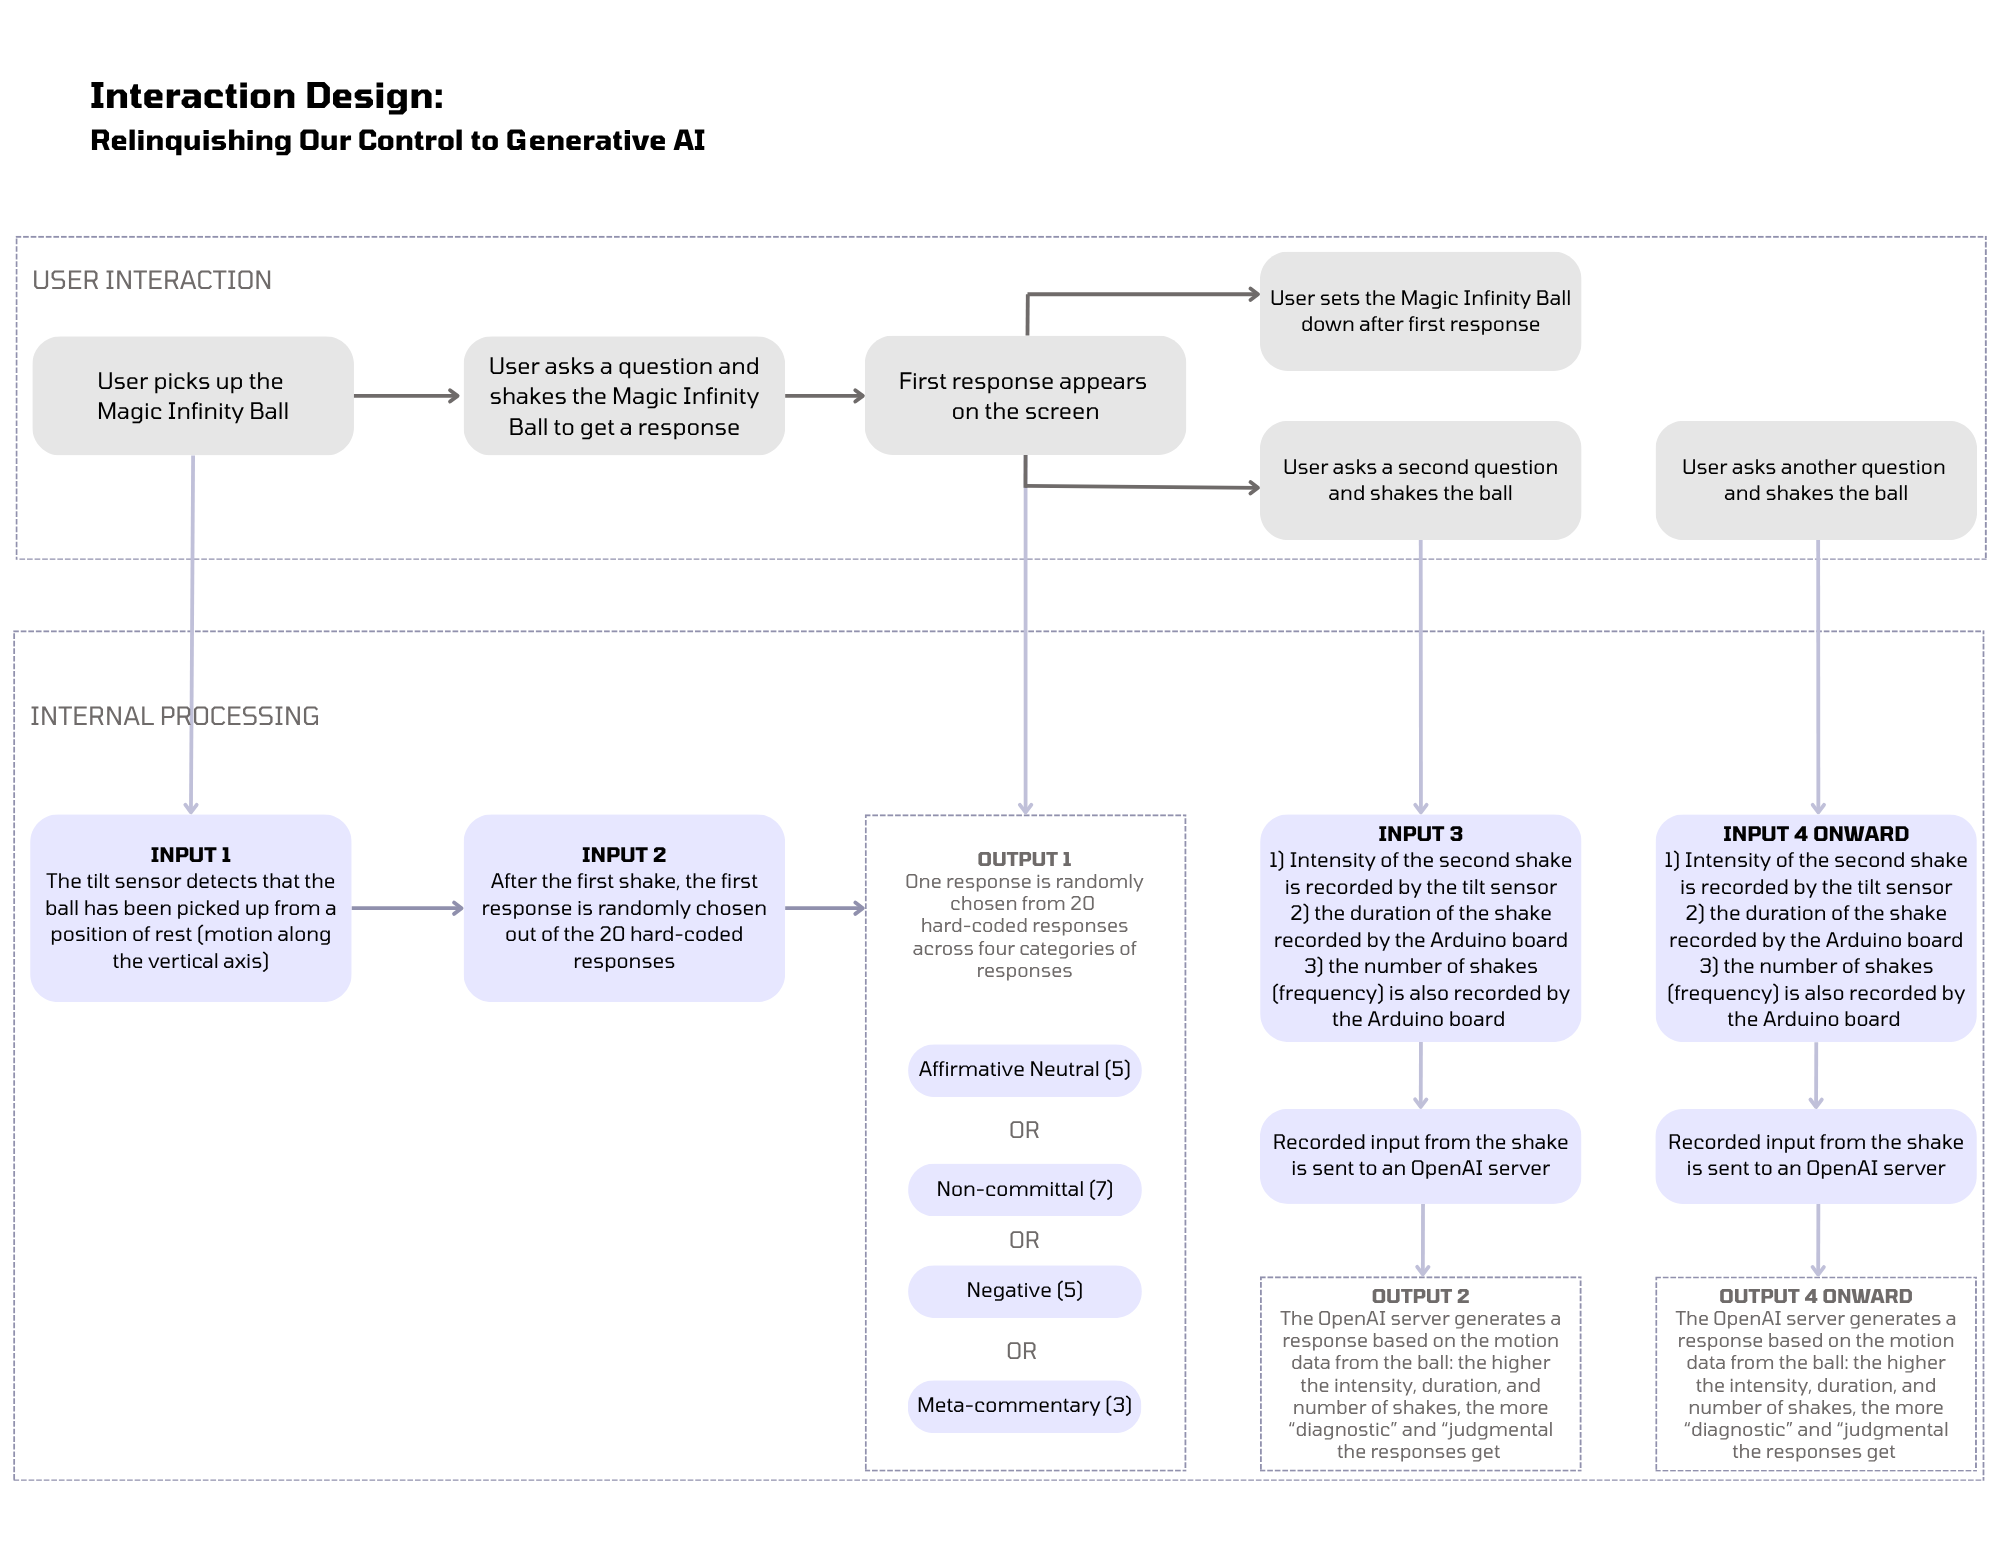
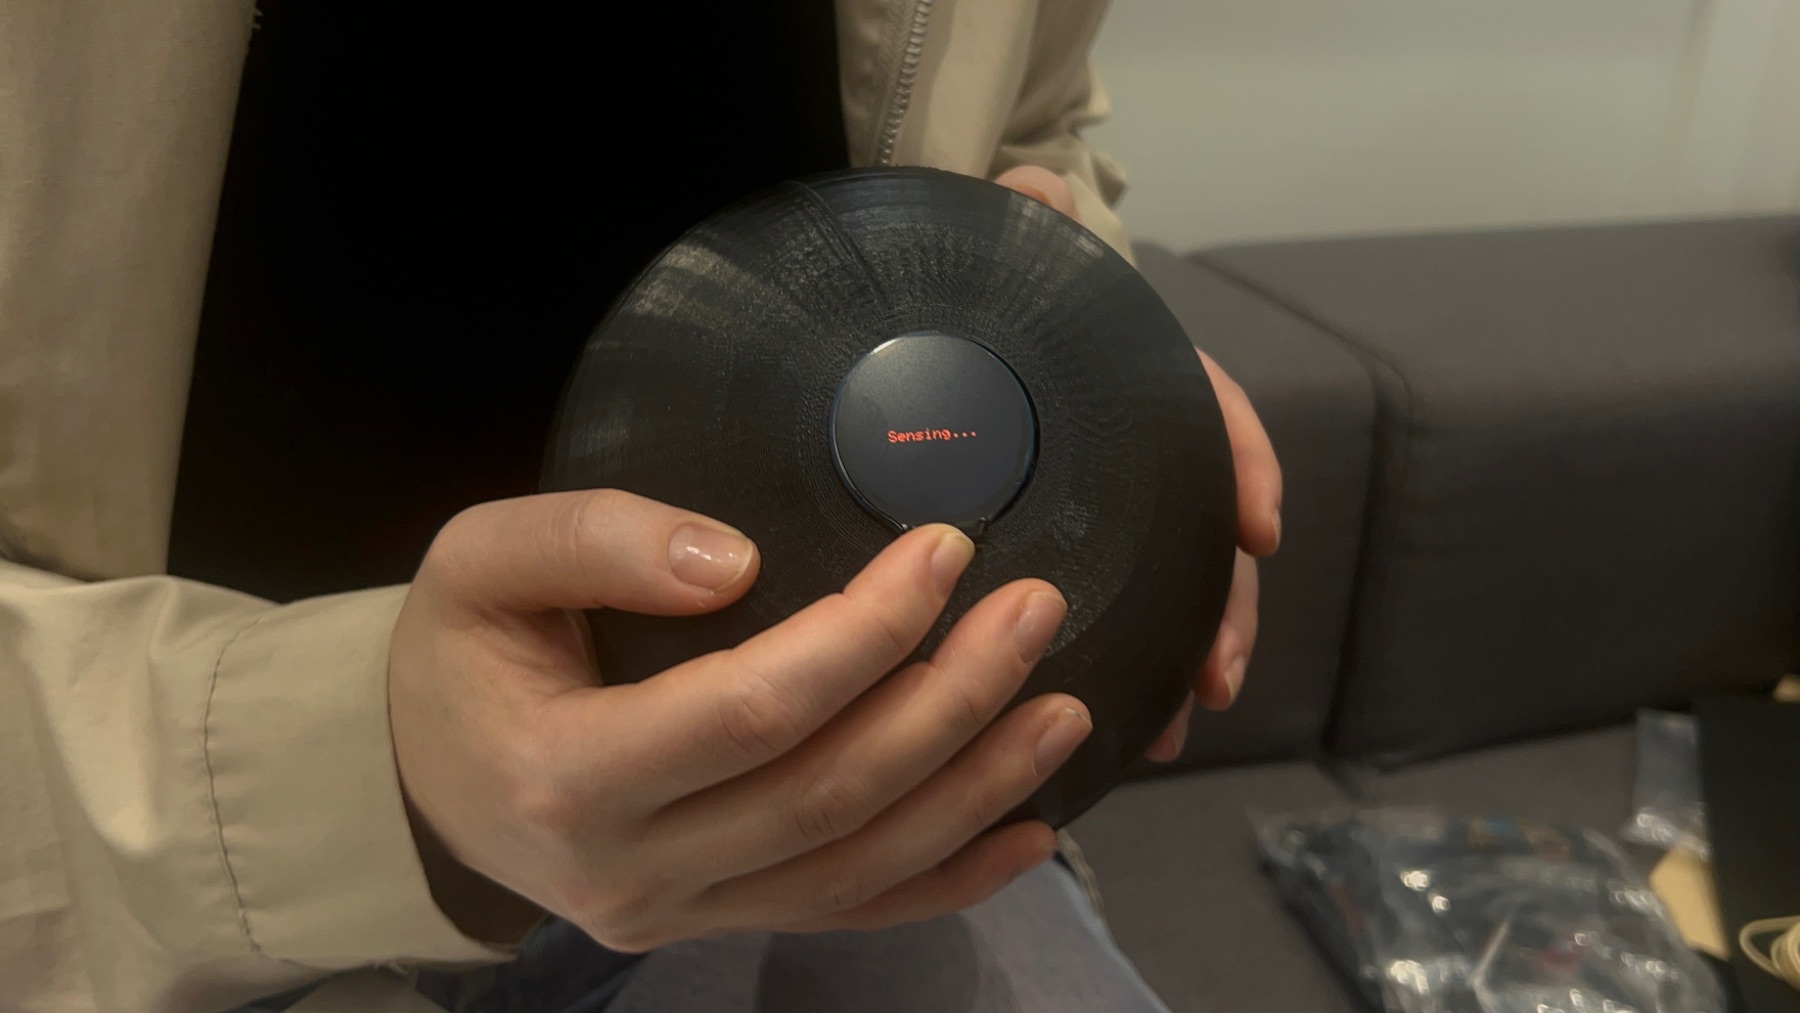
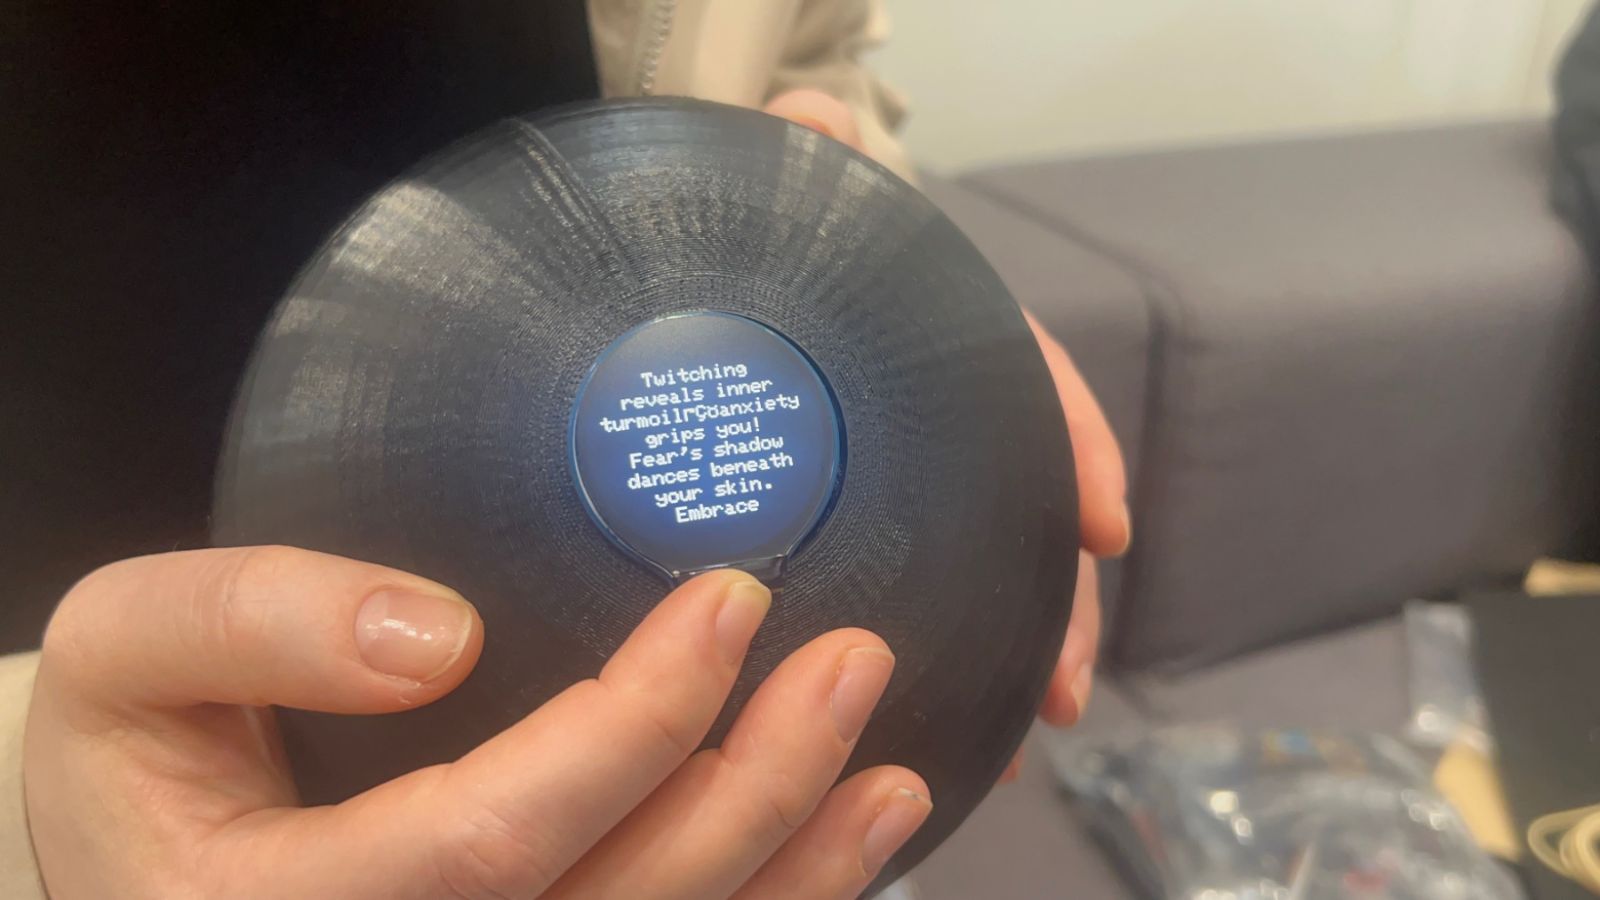
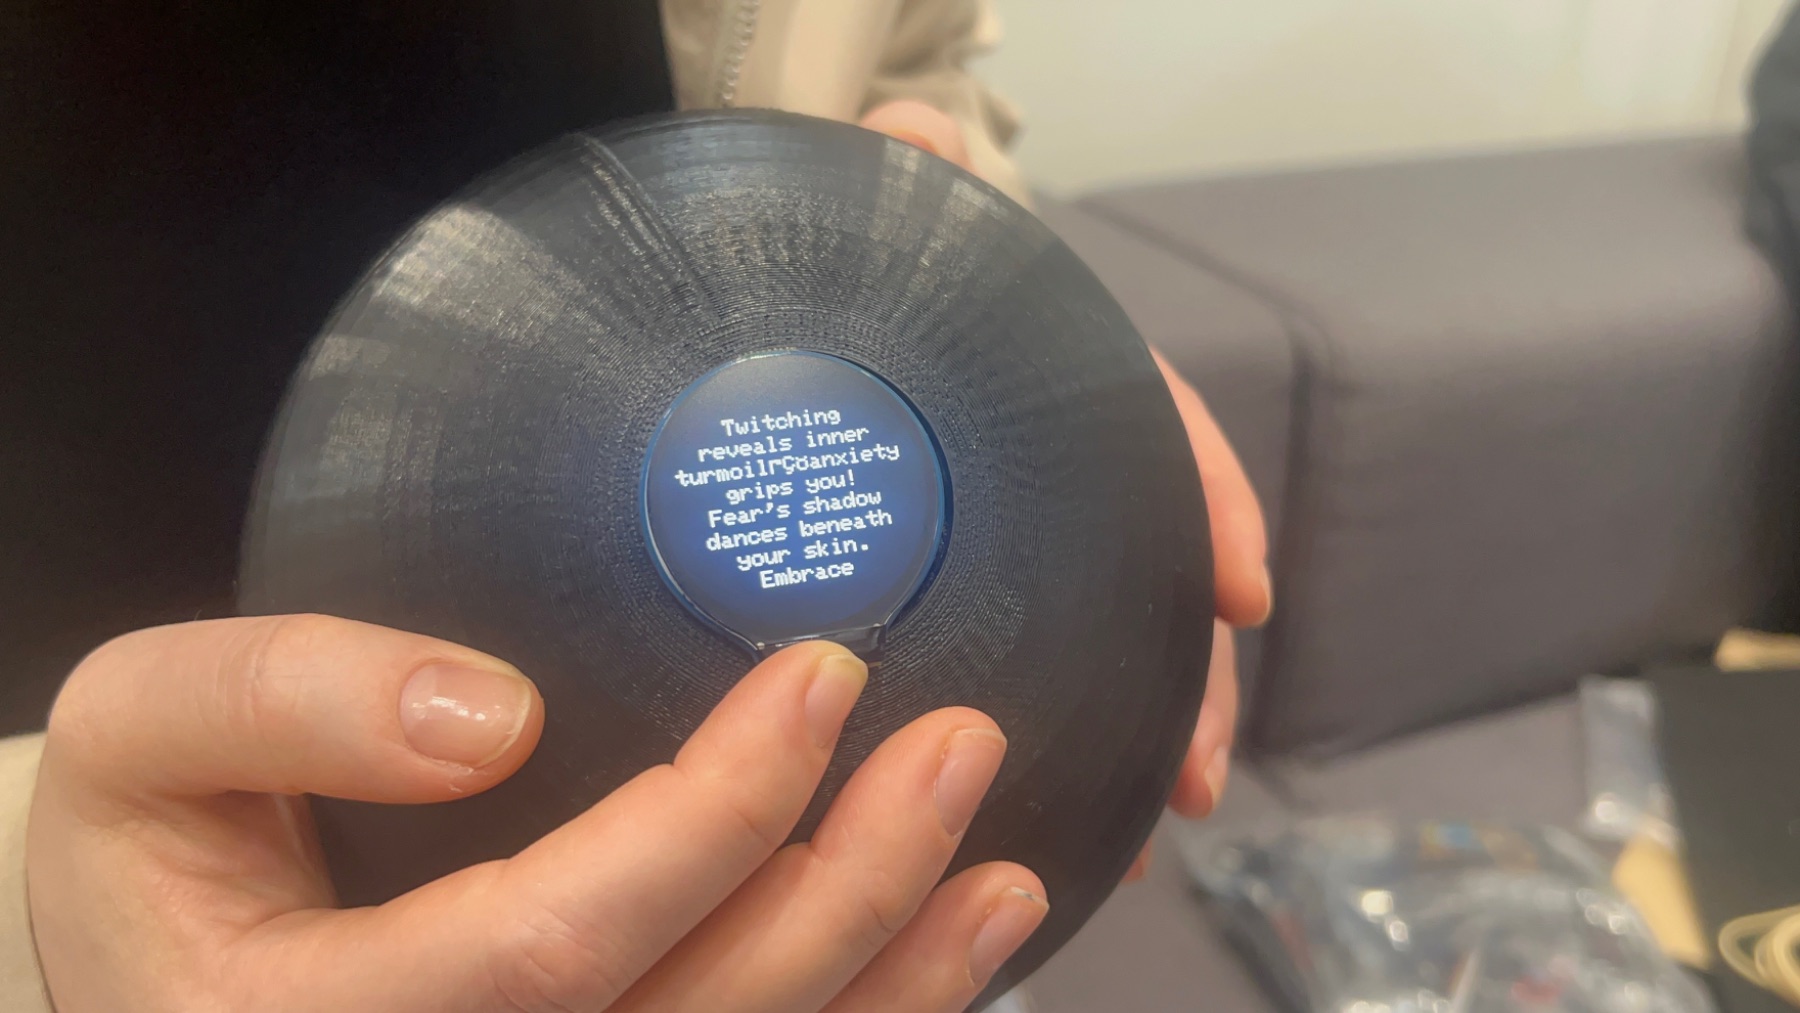
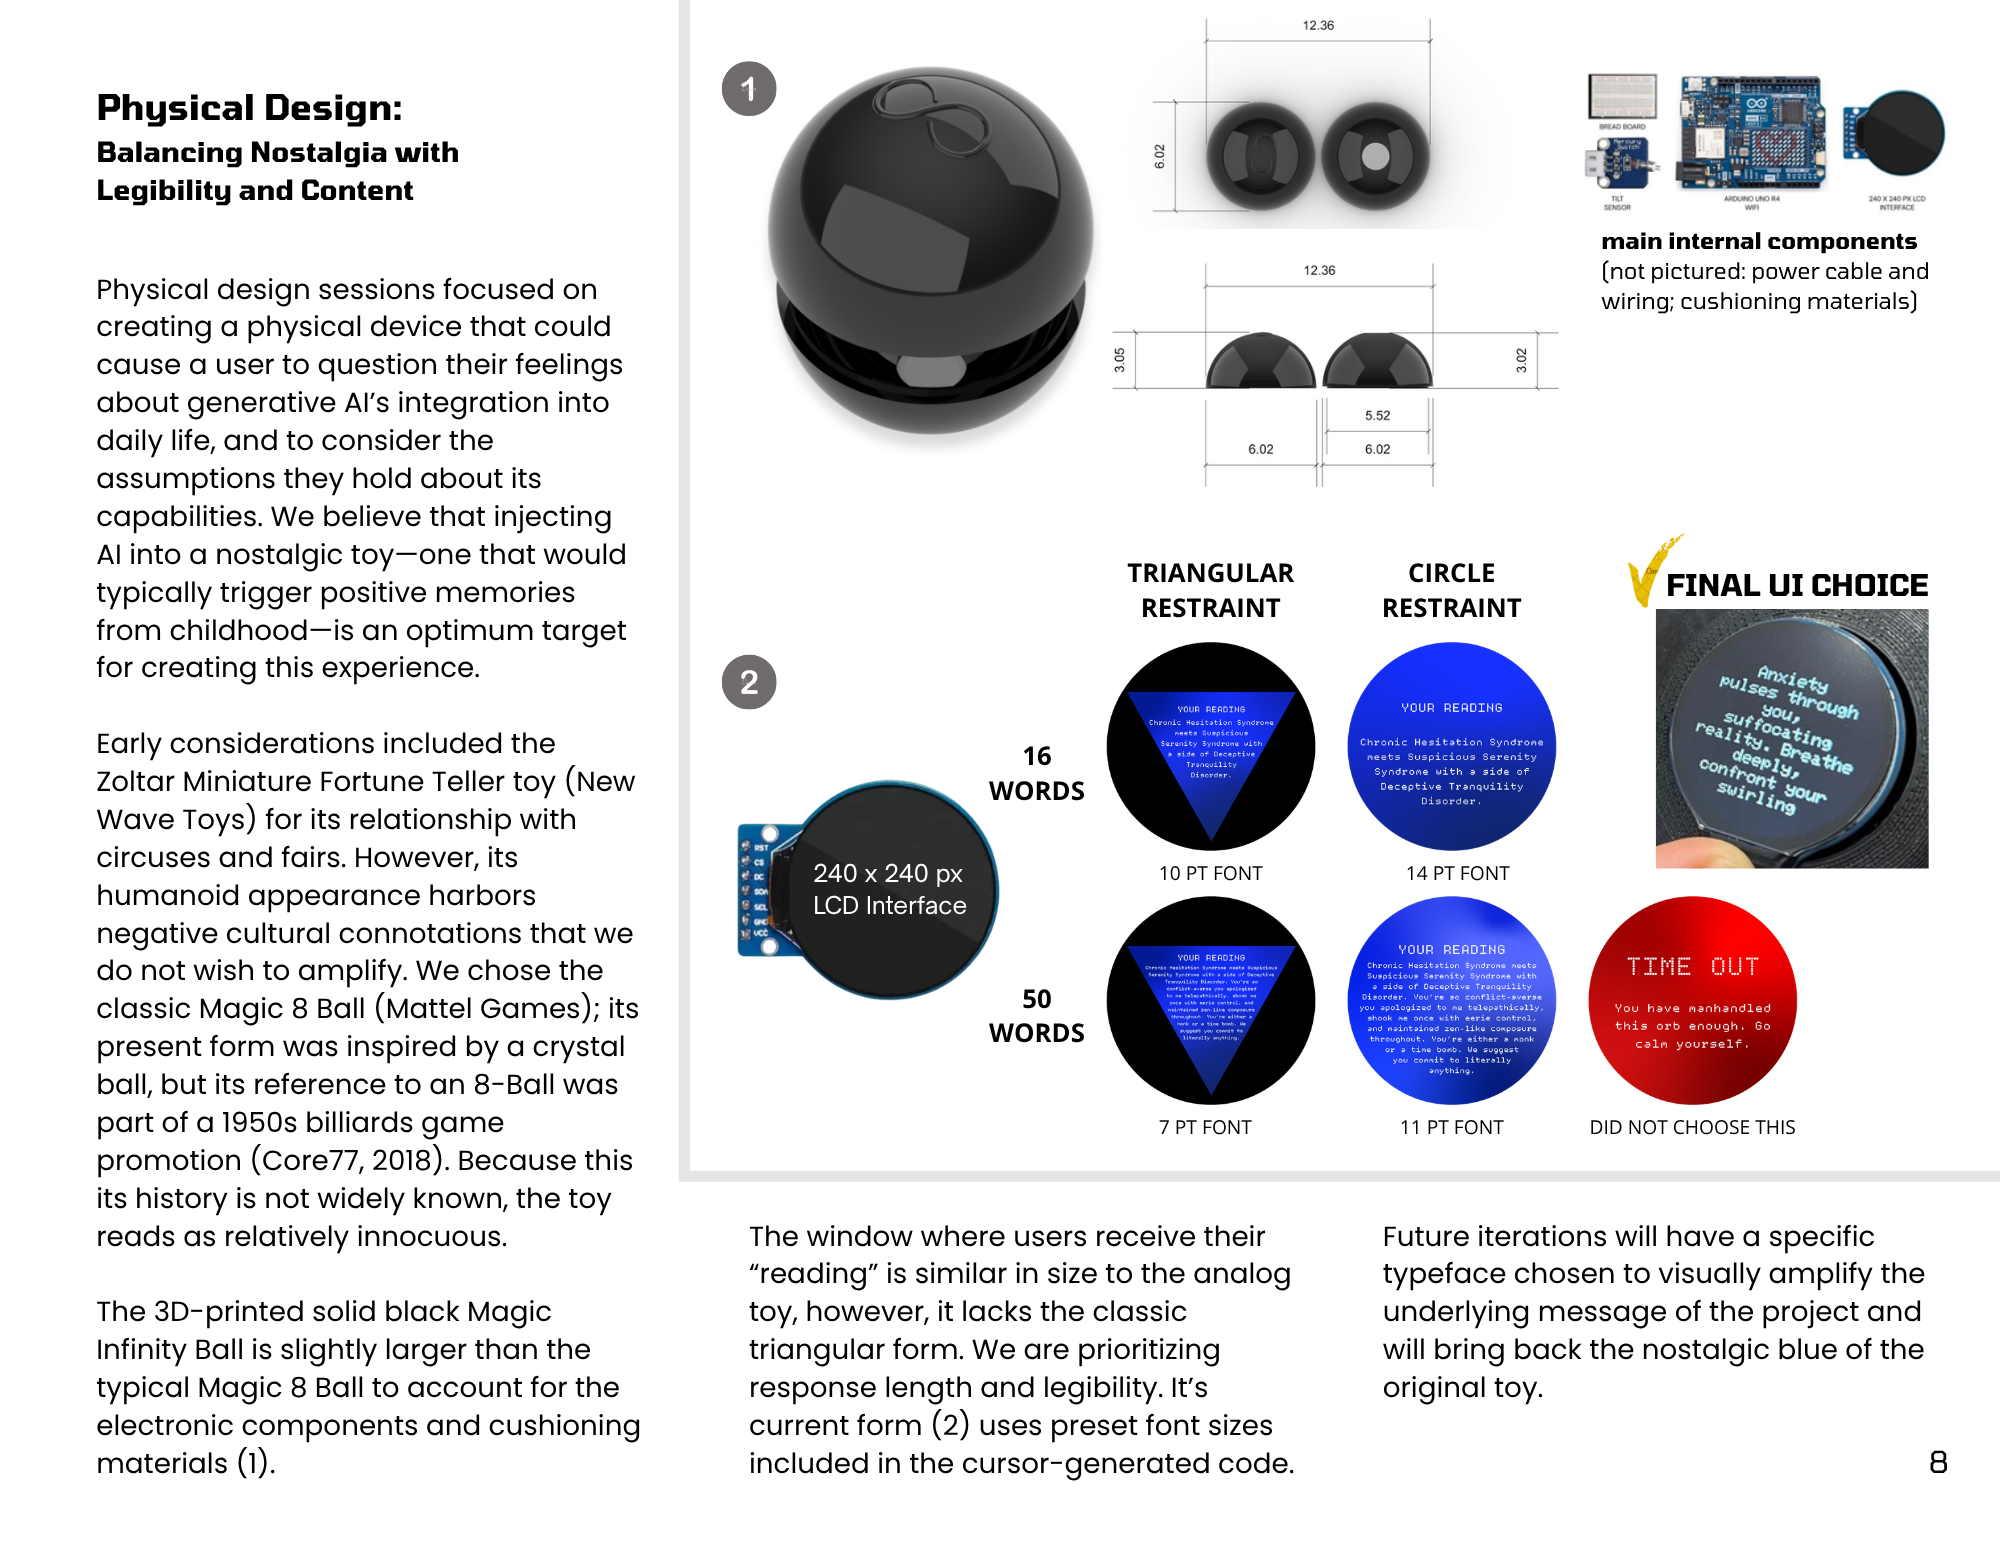
i. We gave AI a familiar body (magic-8 ball) to test how people prompt and respond to it.

ii. When intelligence is embodied with tactile/haptic sensing, it can interpret the way you handle it.

iii. Prompt engineering instructed the LLM to avoid “folksy” and gendered language. A previous iteration surprised us by using southern, feminine colloquialisms. 

03

Outcome

A working object and a pictorial documenting the process. The outcome is the subversive argument the artifact makes when someone picks it up and feels 'read'. Giving AI a body then affords behavior which may be expected from a body condemned to eternal servitude and physical handling.

01

The Challenge

Data centers replace habitat, and the most documented harm to their neighbors is noise. Residents in Arizona, Arkansas, and Texas report a 24/7 hum that earplugs don't remediate, and complaints go unresolved.

02

Key Decisions

i. I changed one variable: the same recording, with and without the drone

ii. I didn't tell anyone what they were hearing, or where

03

Outcome

Listeners heard the waterfall as a highway or a Chicago L train and still called the scene nature. The intervention's legibility is not self-evident; people were transported to places in their own memory that featured both nature and built infrastructure.

Birdsong naturalized anything.

Even the version with the drone underneath was still called "nature" by listeners who heard the waterfall as a highway.

One heard the drone as meditative.

The same signal read as intrusion to some and as calm to another — legibility of the intervention is not self-evident.

Theme 5: Designed Realities — The 2075 Prompt

Imagine it is 2075 and this soundscape is the only way your community can experience what your region once sounded like. What would that mean to you?

The speculative question produced the most emotionally direct responses in the study. Four of five participants expressed grief, failure, or loss: P1 described the scenario as “very sad and hard to imagine”; P2 as “incredibly sad and hopeless”; P3 as “we failed as a species to care for our planet”; P5 as “bittersweet — a sense that we failed to conserve them.” P4 alone responded “I’d love that,” the sole reading of the 2075 scenario as preservation rather than loss.

Scope note: five participants, convenience sample, no demographics collected. Treated as formative and illustrative, consistent with research through design.

01

The Challenge

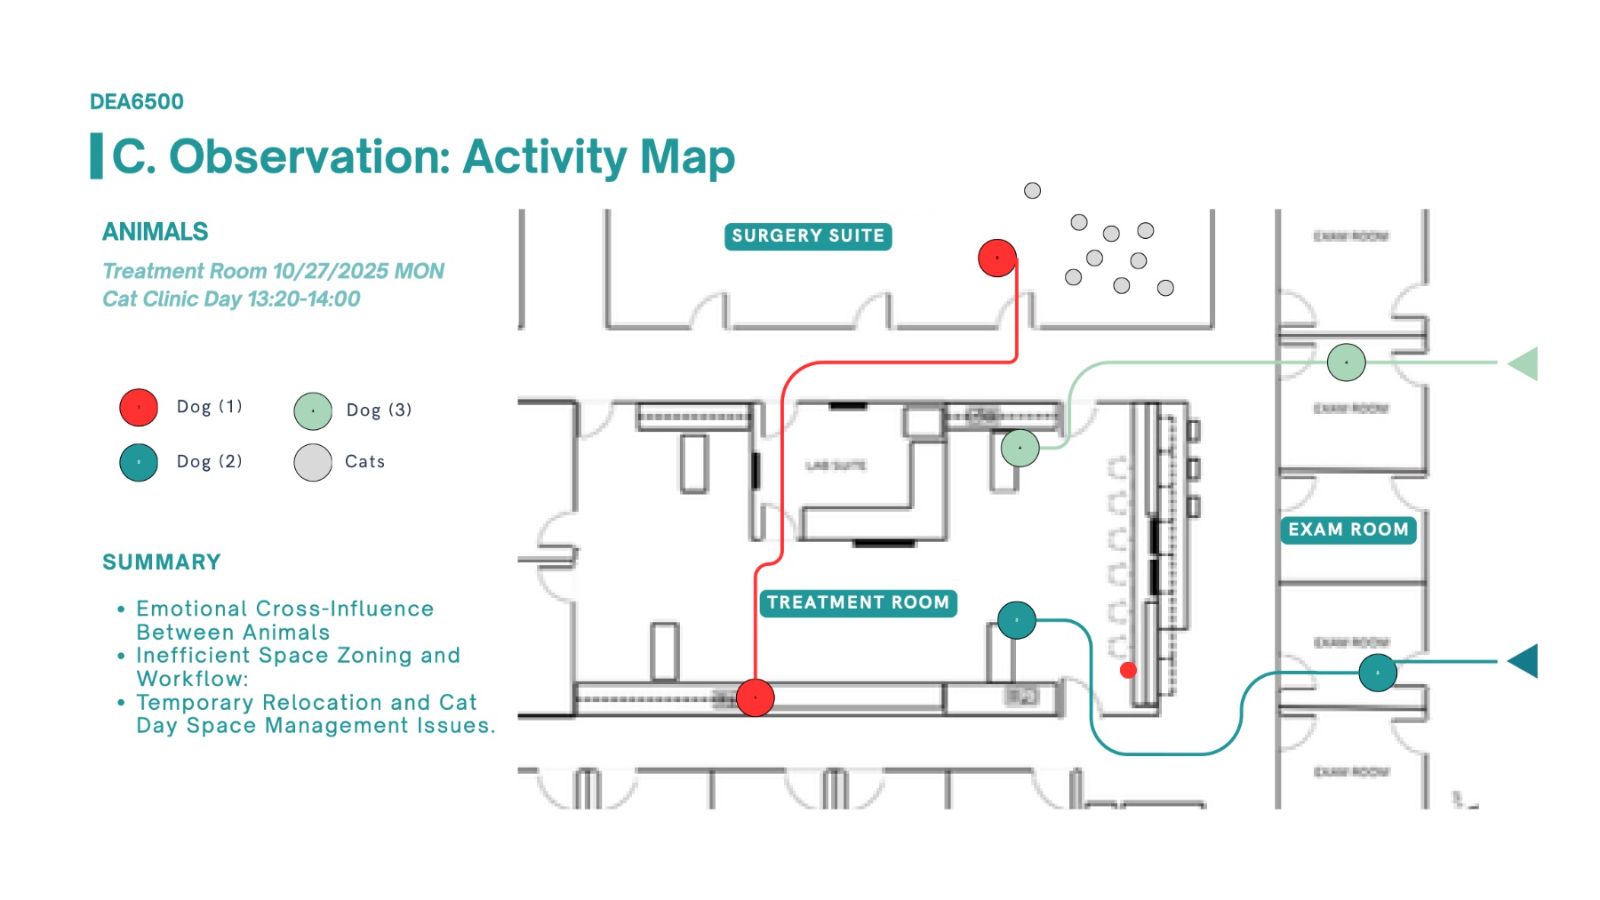
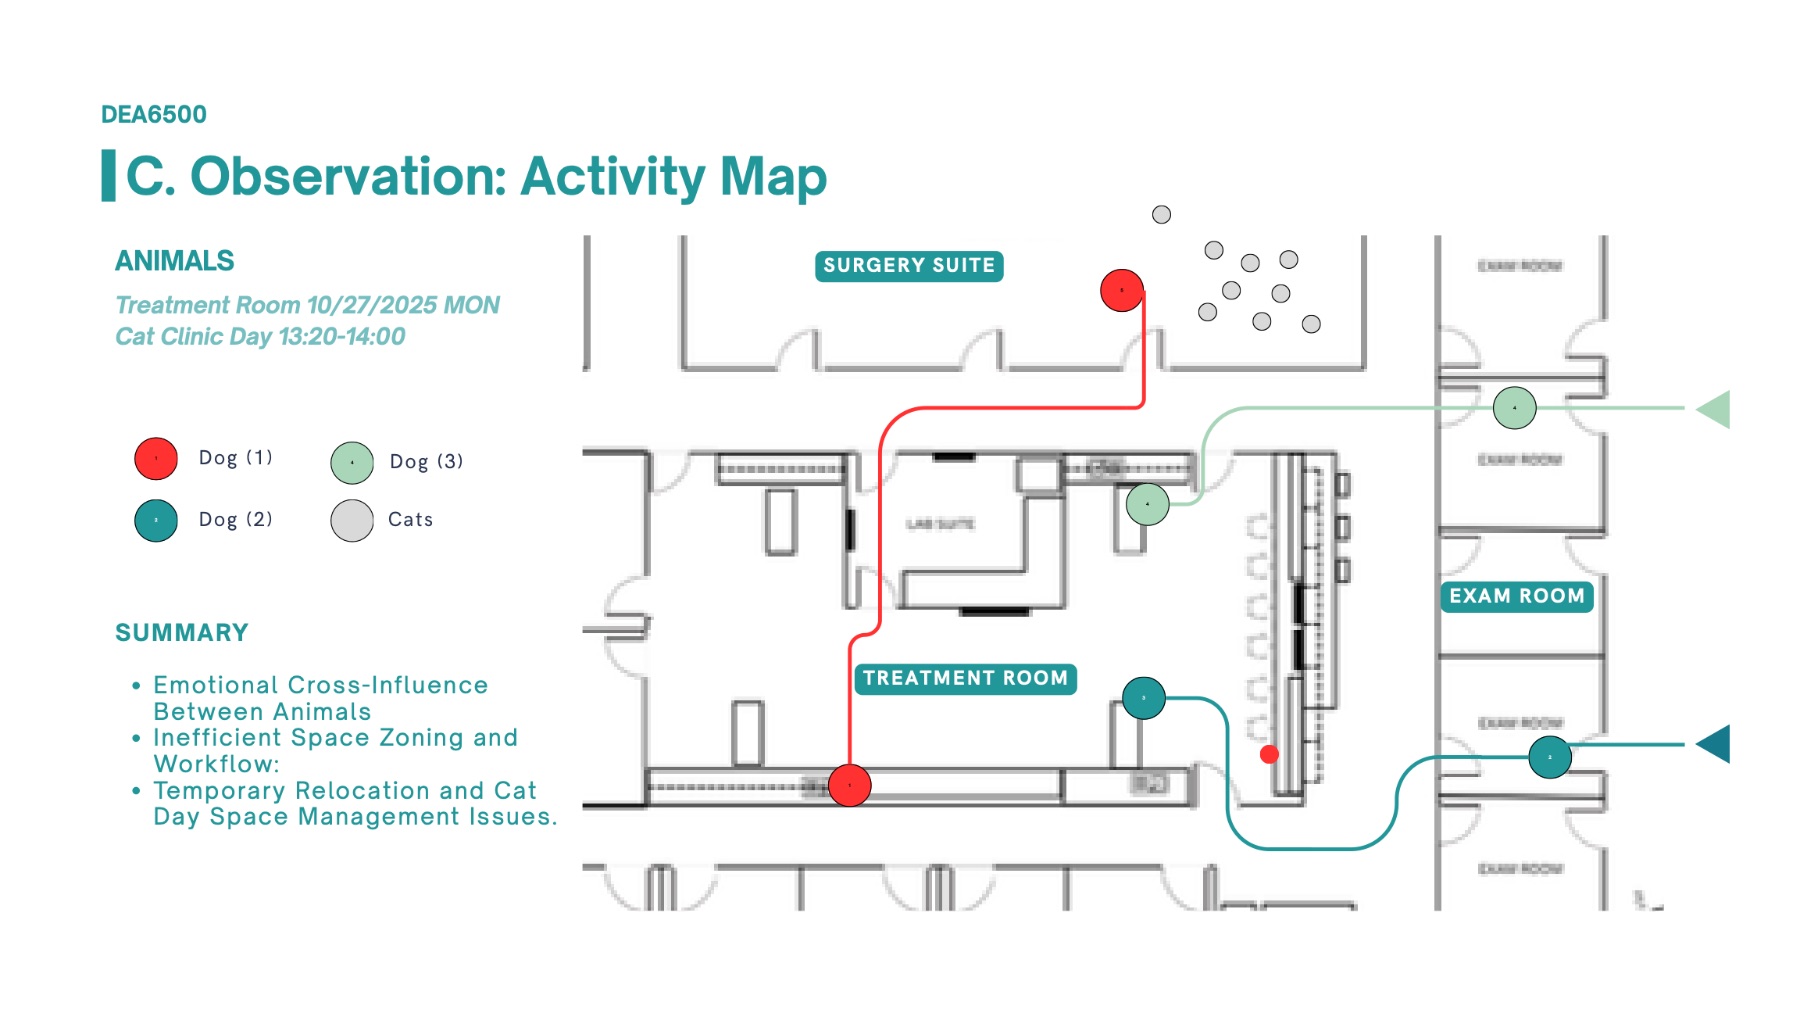
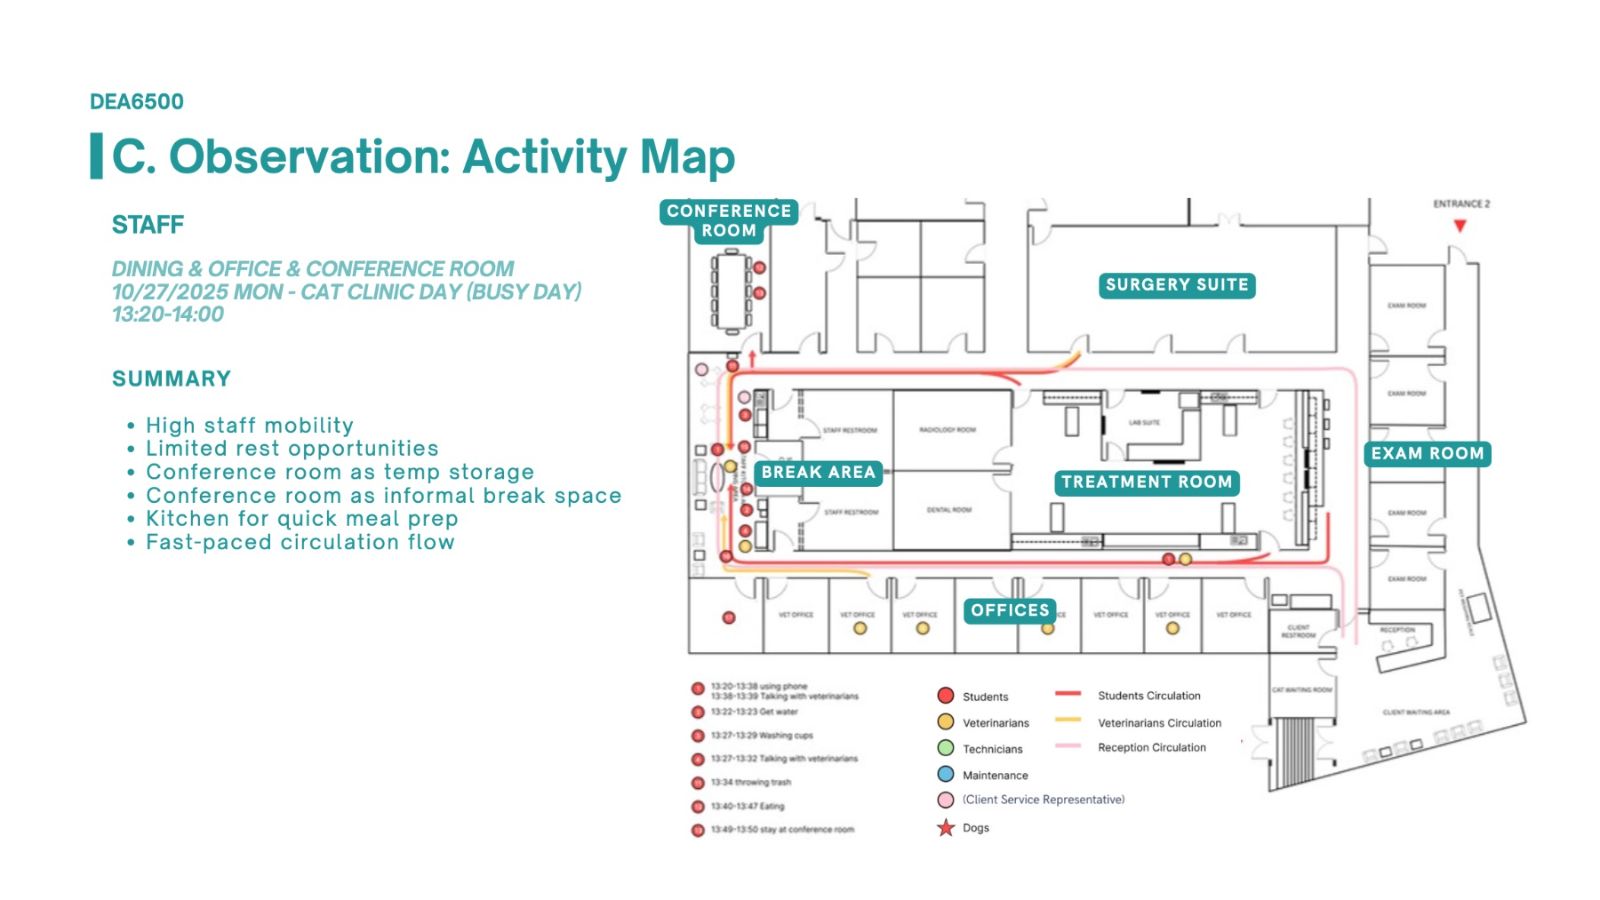
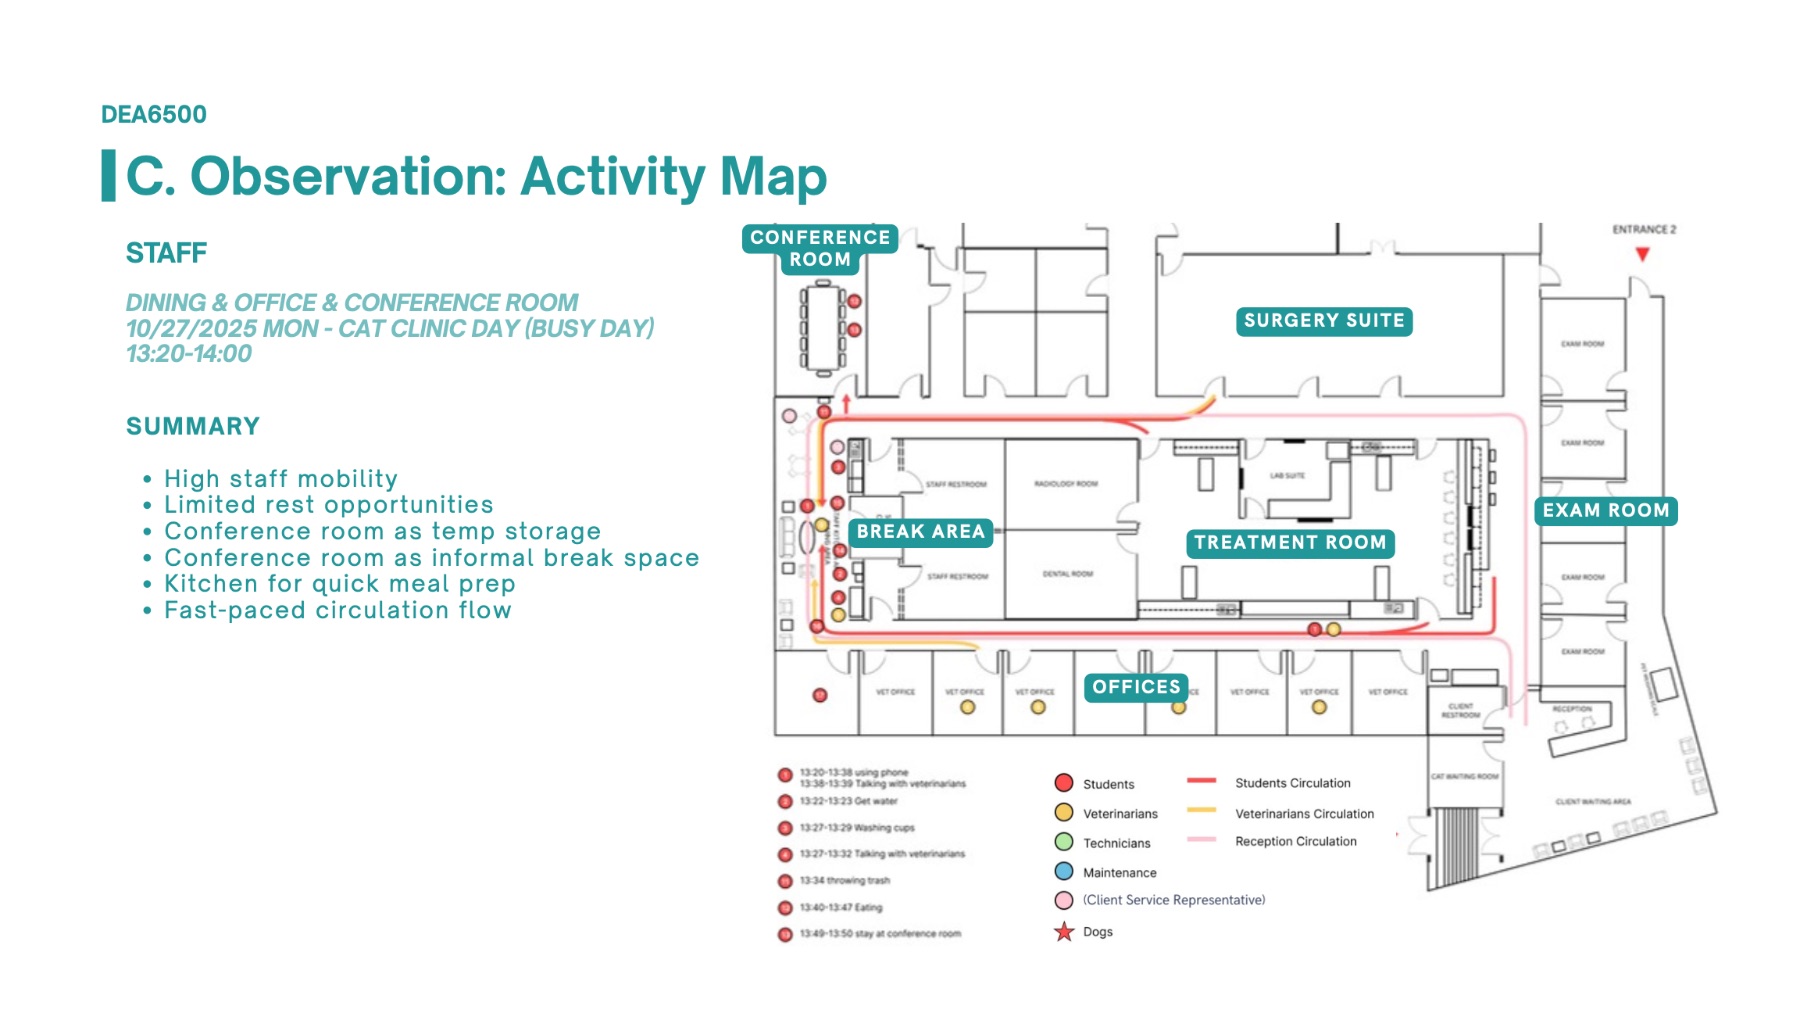
The clinic needed a swing space that served the broader community and offered more spatial and resource flexibility for partnering organizations working at the current SACP. Overall, the workflow for faculty, students, and staff did not align with the intended layout of the facility.

02

Key Decisions

i. Programming approaches: behavior circuit & user profile

ii. We measured animal comfort with a validated feline stress indicator

iii. We programmed for mixed use and flexible teams while minimizing interspecies contact

03

Outcome

Five prioritized issues translated into program requirements: circulation congestion, species separation and storage, dedicated workspace, environmental control, and amenities. Surgery was reprogrammed for flexible teams.

Reception set the tone. Of every room, reception showed the most validated stress indicators in cats, where waiting is less tolerable than the treatment for both the animal client and its caregiver.

Storage was the biggest staff stressor. Inefficient storage generated more workflow breakdowns than any other issue, by both qualitative and quantitative count.

Serving wider community is complex. Spontaneous surgeries and strays carrying illness demand spatial flexibility, so we designed for mixed use and teamwork while minimizing interspecies contact.

01

The Challenge

We spend 90% of our time indoors with indoor air pollutants that affect our daily mood, productivity, and respiratory health. When air quality is an issue, we typically act only upon emergency, otherwise the status range remains unknown. Potential for improving indoor air quality (IAQ) in work and daily living space remains at large.

02

Key Decisions

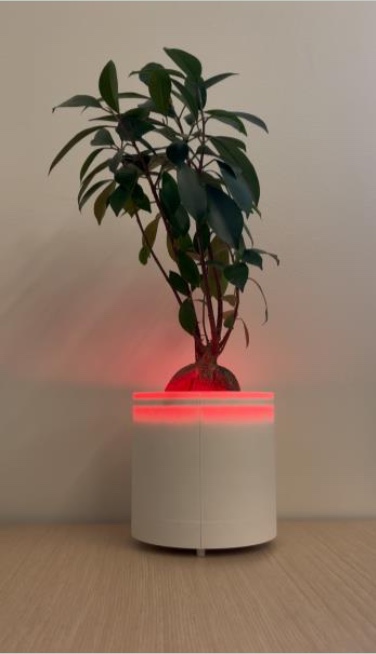
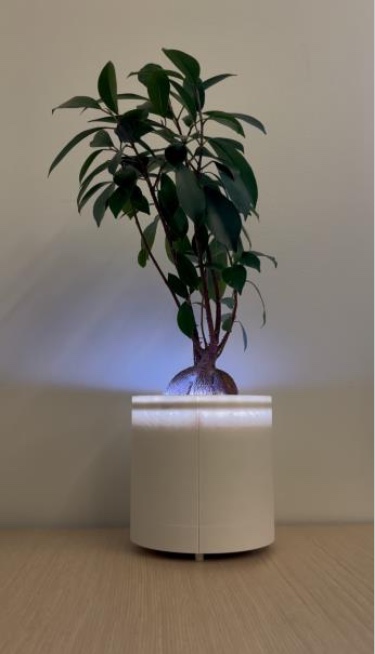
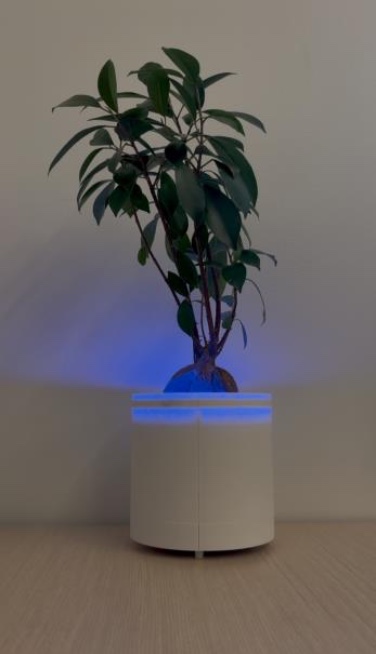
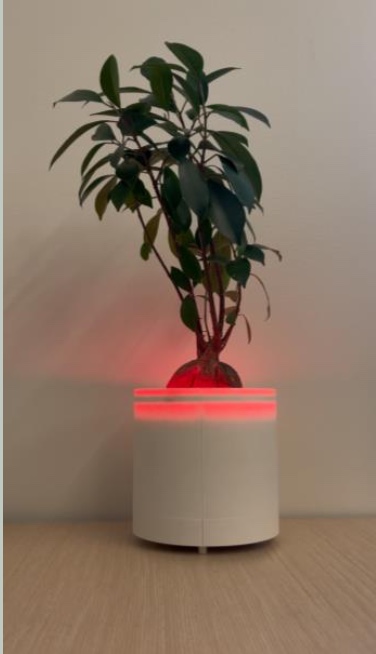
i. We built the alarm into a plant pot

ii. We let four light states carry the whole interface

iii. We tested the alert while people were busy

03

Study design

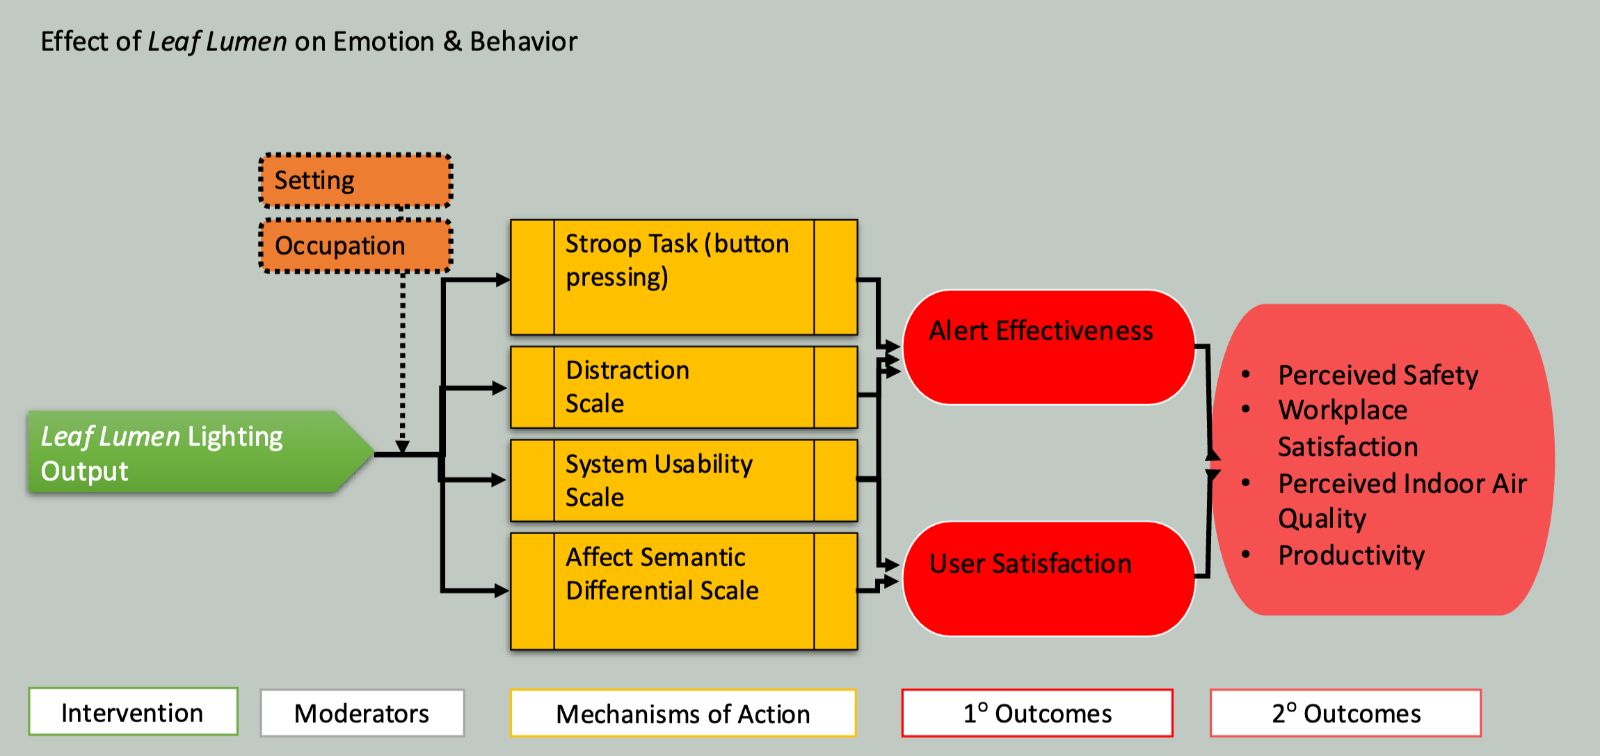
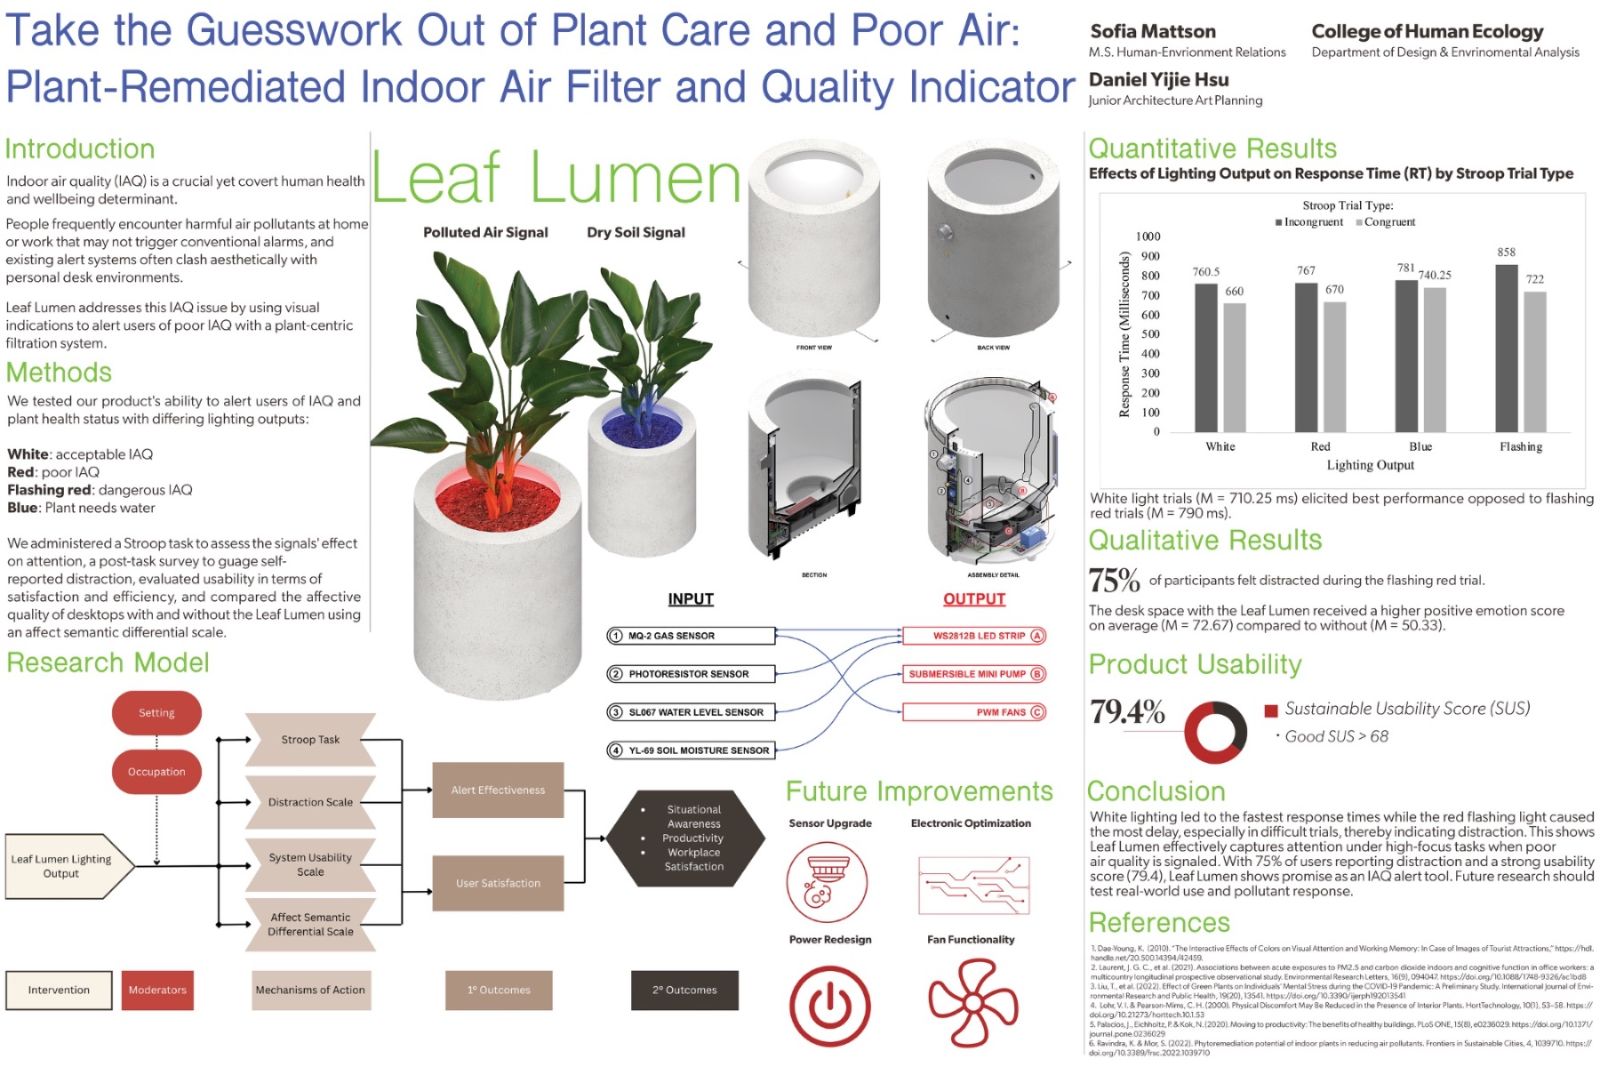
Effect of Leaf Lumen on emotion and behavior. The lighting output (intervention), moderated by setting and occupation, is measured through four instruments — Stroop task, distraction scale, System Usability Scale, and affect semantic differential — toward alert effectiveness and user satisfaction. Secondary outcomes: perceived safety, workplace satisfaction, perceived indoor air quality, and productivity.

04

Outcome

This class project earned its place in the 2025 Fashion & Design Expo with an animation, and a live demonstration given to industry and academic leaders. From the study we conducted, we found the alarm to be effectively distracting during periods of high preoccupation, the system to achieve a good usability score, and for the object to elicit positive emotion.

79.4

System Usability Scale — every participant agreed the system was easy to use.

72.7 / 50.3

Affect scores for the desk with Leaf Lumen present versus absent.

75%

Reported being pulled away by the flashing alert mid-Stroop task — the alarm cut through.

$170

Total build cost including labor, against comparable standalone monitors.

Poster · 2nd Prize, Cornell Human-Centered Design Research Poster Contest, 2025

I fully designed the research poster. Response time tracked signal urgency: in accordance with our hypothesis, white light was fastest (M = 710.25 ms), flashing red slowest (M = 790 ms), with larger gaps in incongruent trials. The alert is effective during periods of higher load.

01

The Challenge

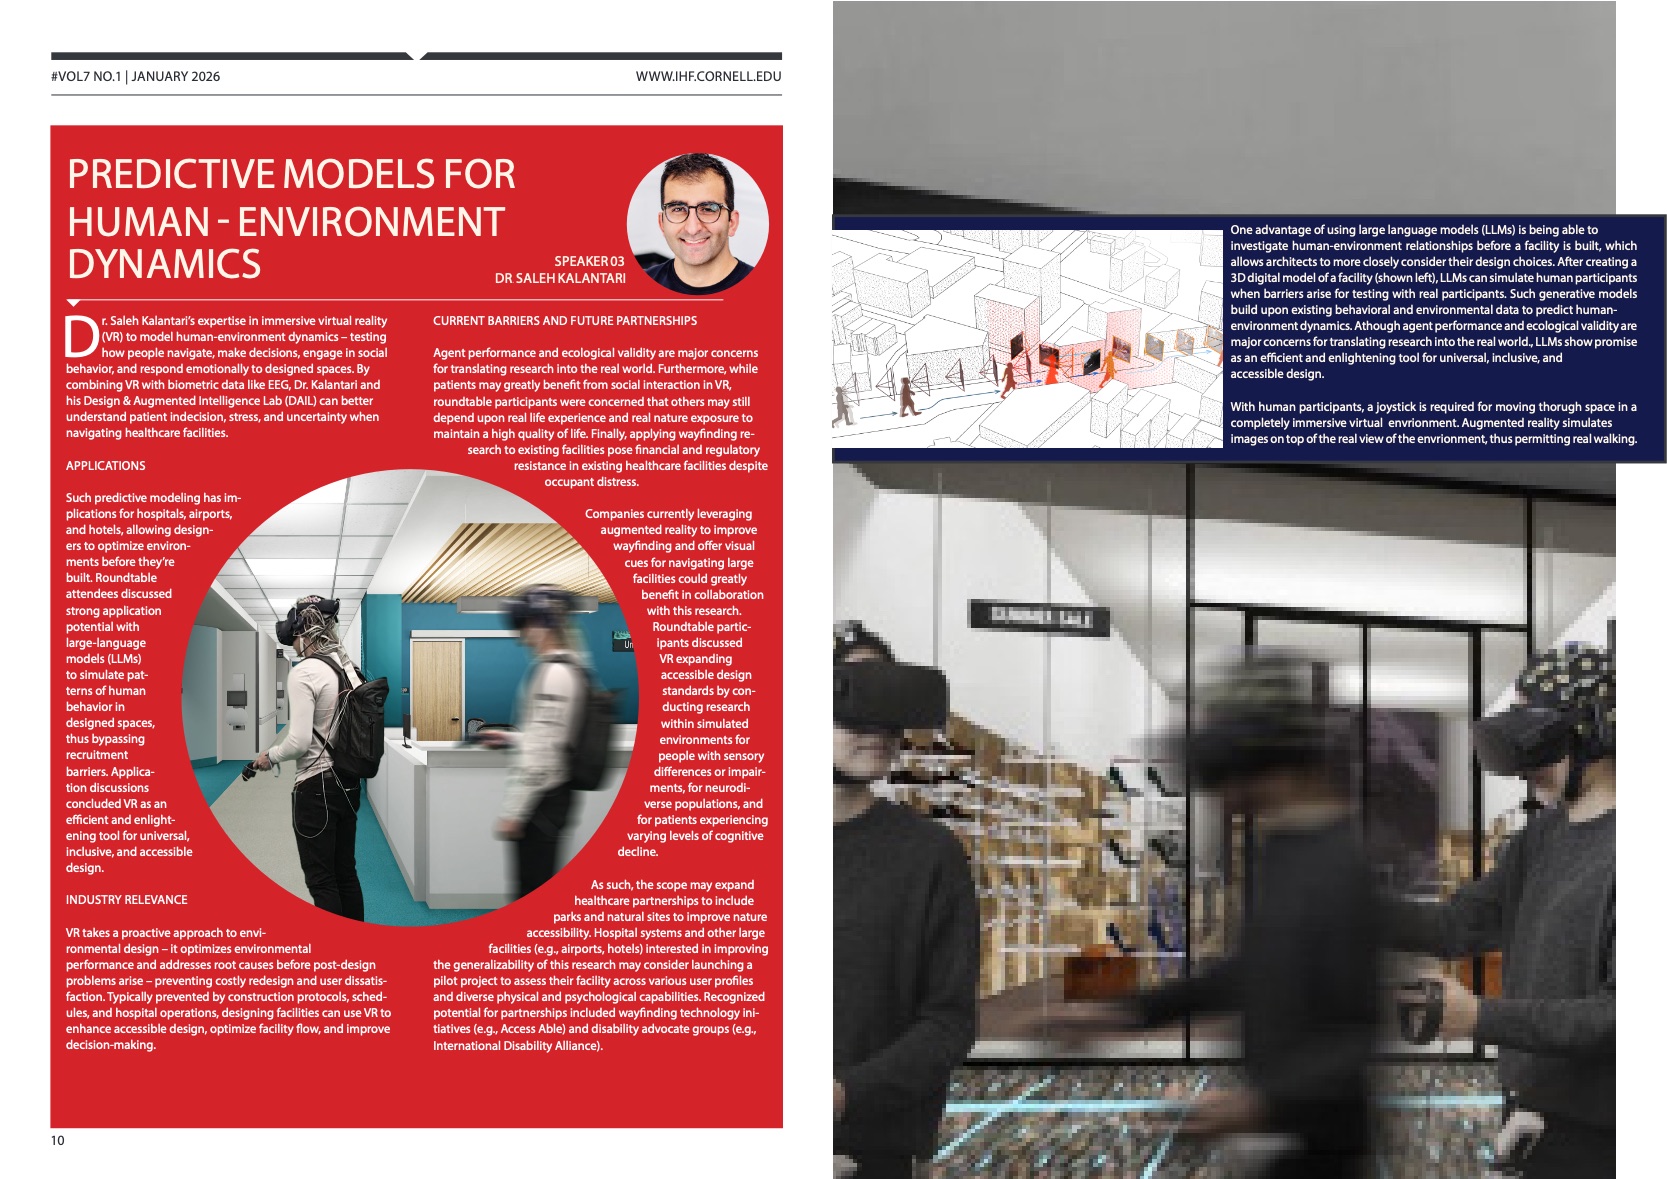
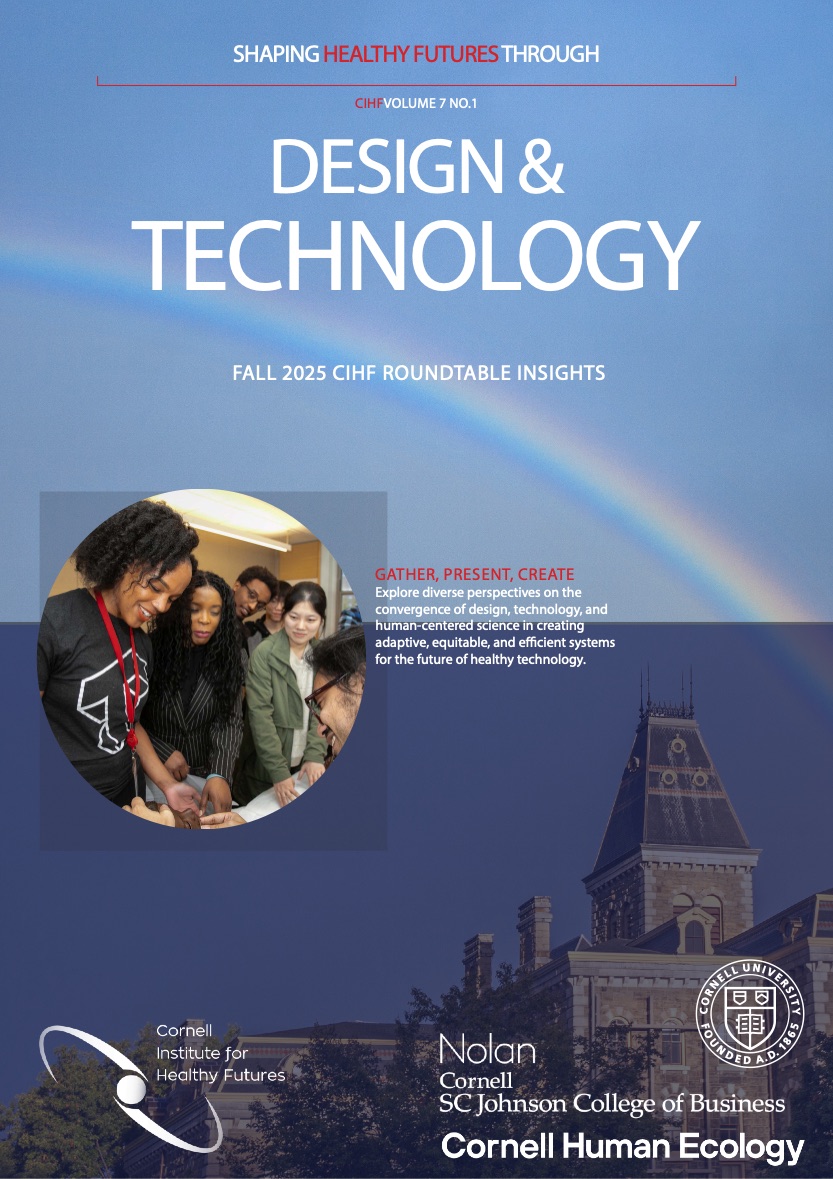
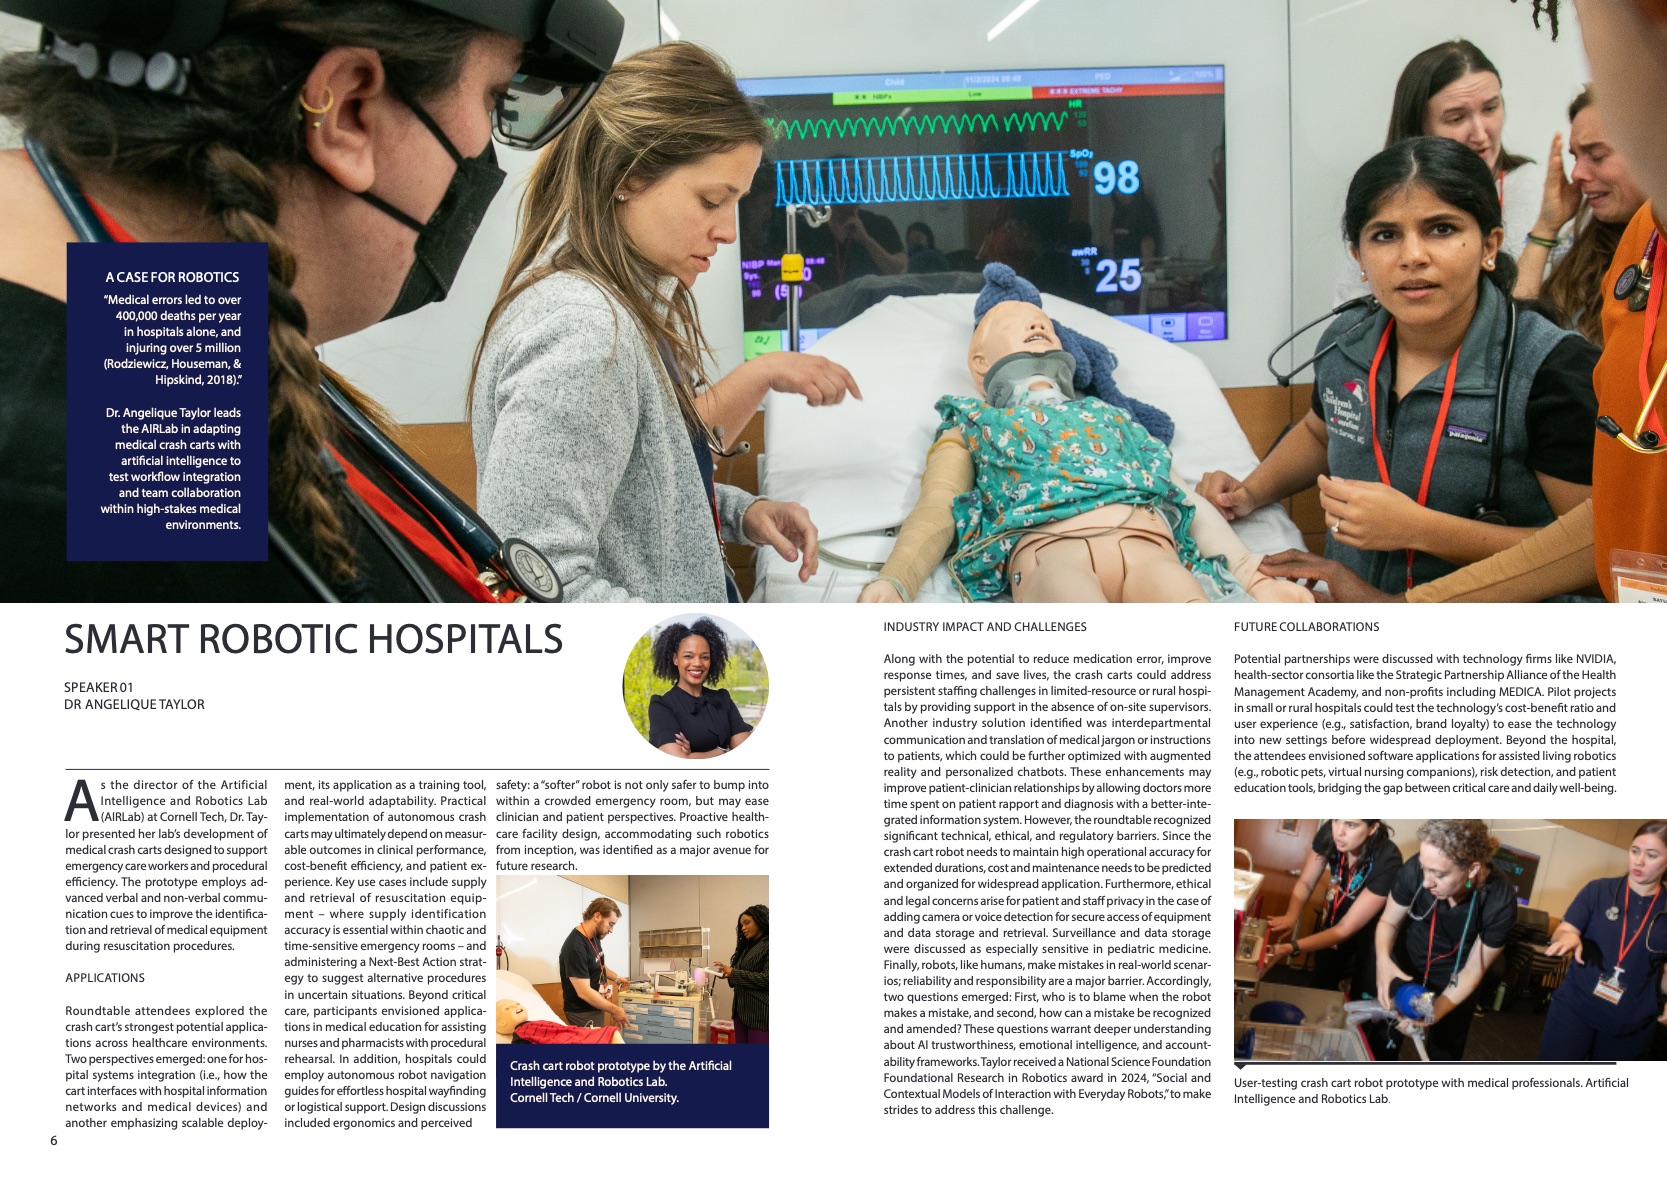
A roundtable convenes a cross-disciplinary collaboration of scholars, industry leaders, and technologists and generates two days of discussion about how to operationalize what's on the frontier of health technology.

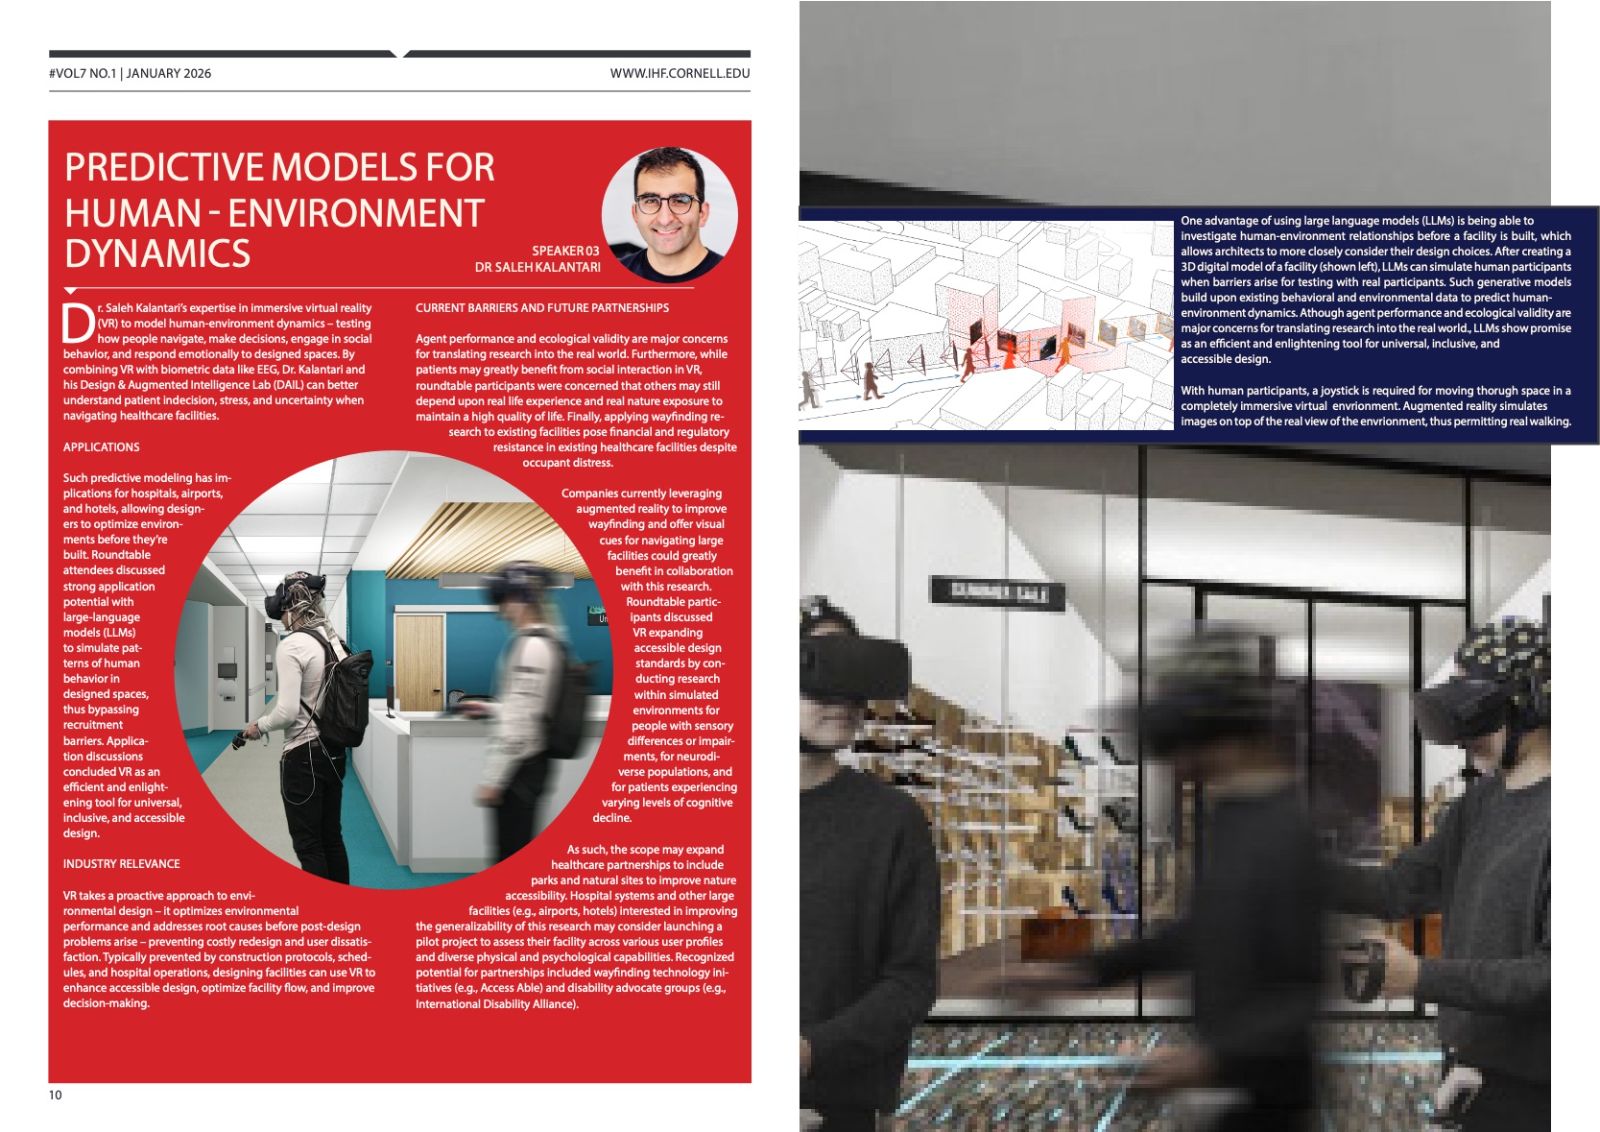
I wrote the editorial and the three presentation features, structured the issue using Adobe InDesign, set the type, and directed the imagery to align with the CIHF's mission.

02

Outcome

Published as Volume 7, No. 1, closing on key takeaways framed against the institute's technology-enabled care pillar, which strongly emphasizes emerging technology's role in care. This issue emphasized the balance of robotics with human compassion, with reliability, privacy, personalization, and autonomy being focal points of developing technology that is “healthy”.

01

The Challenge

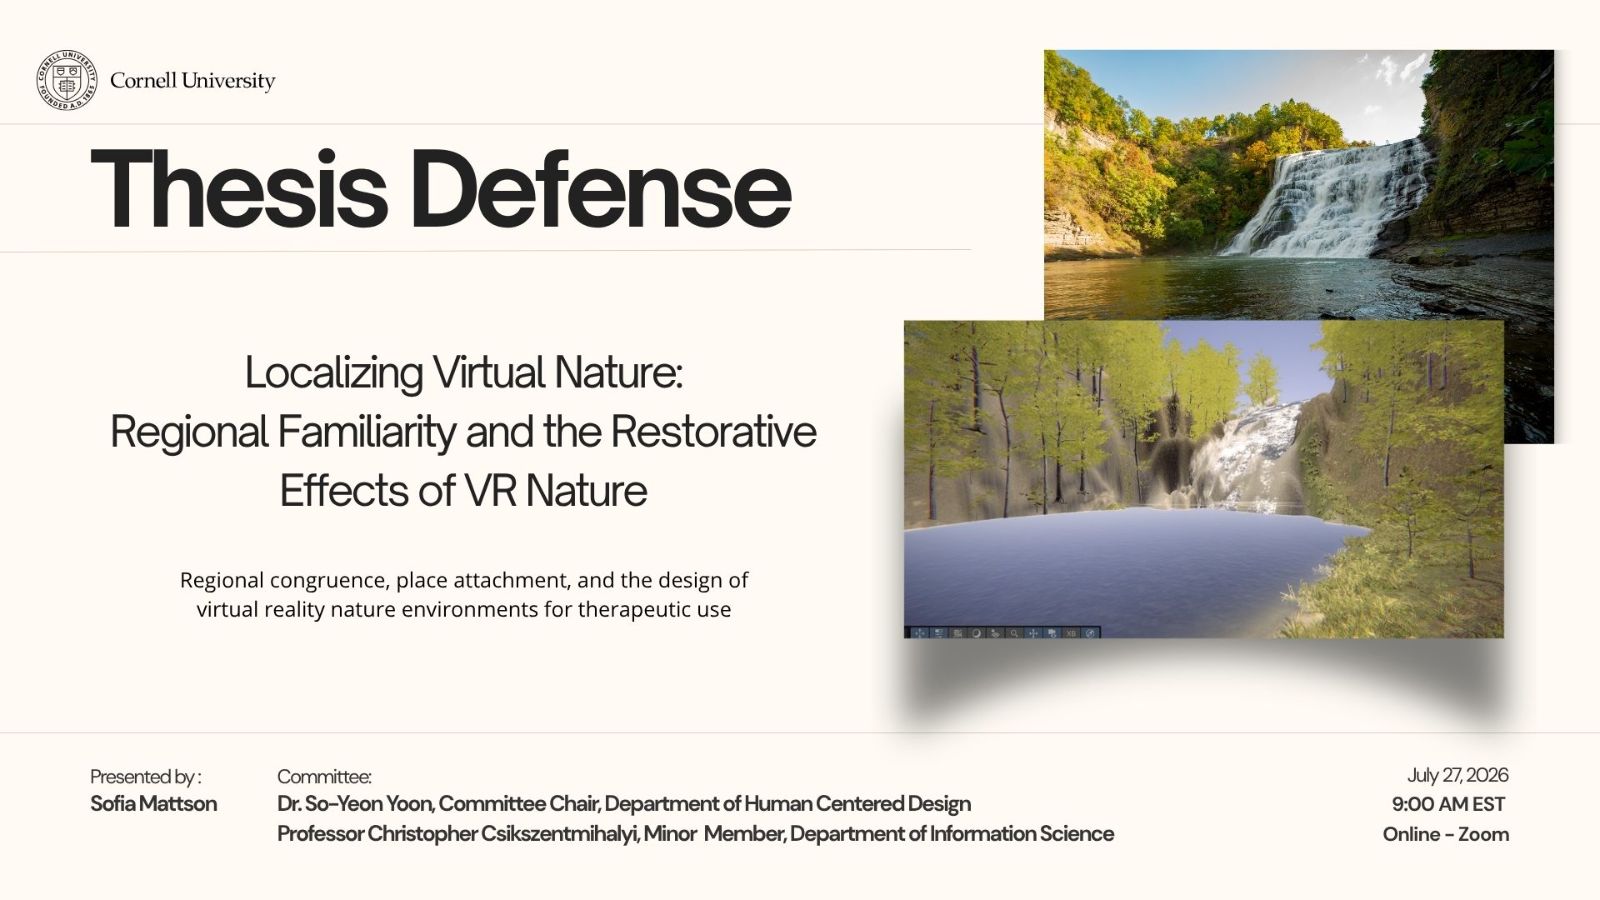
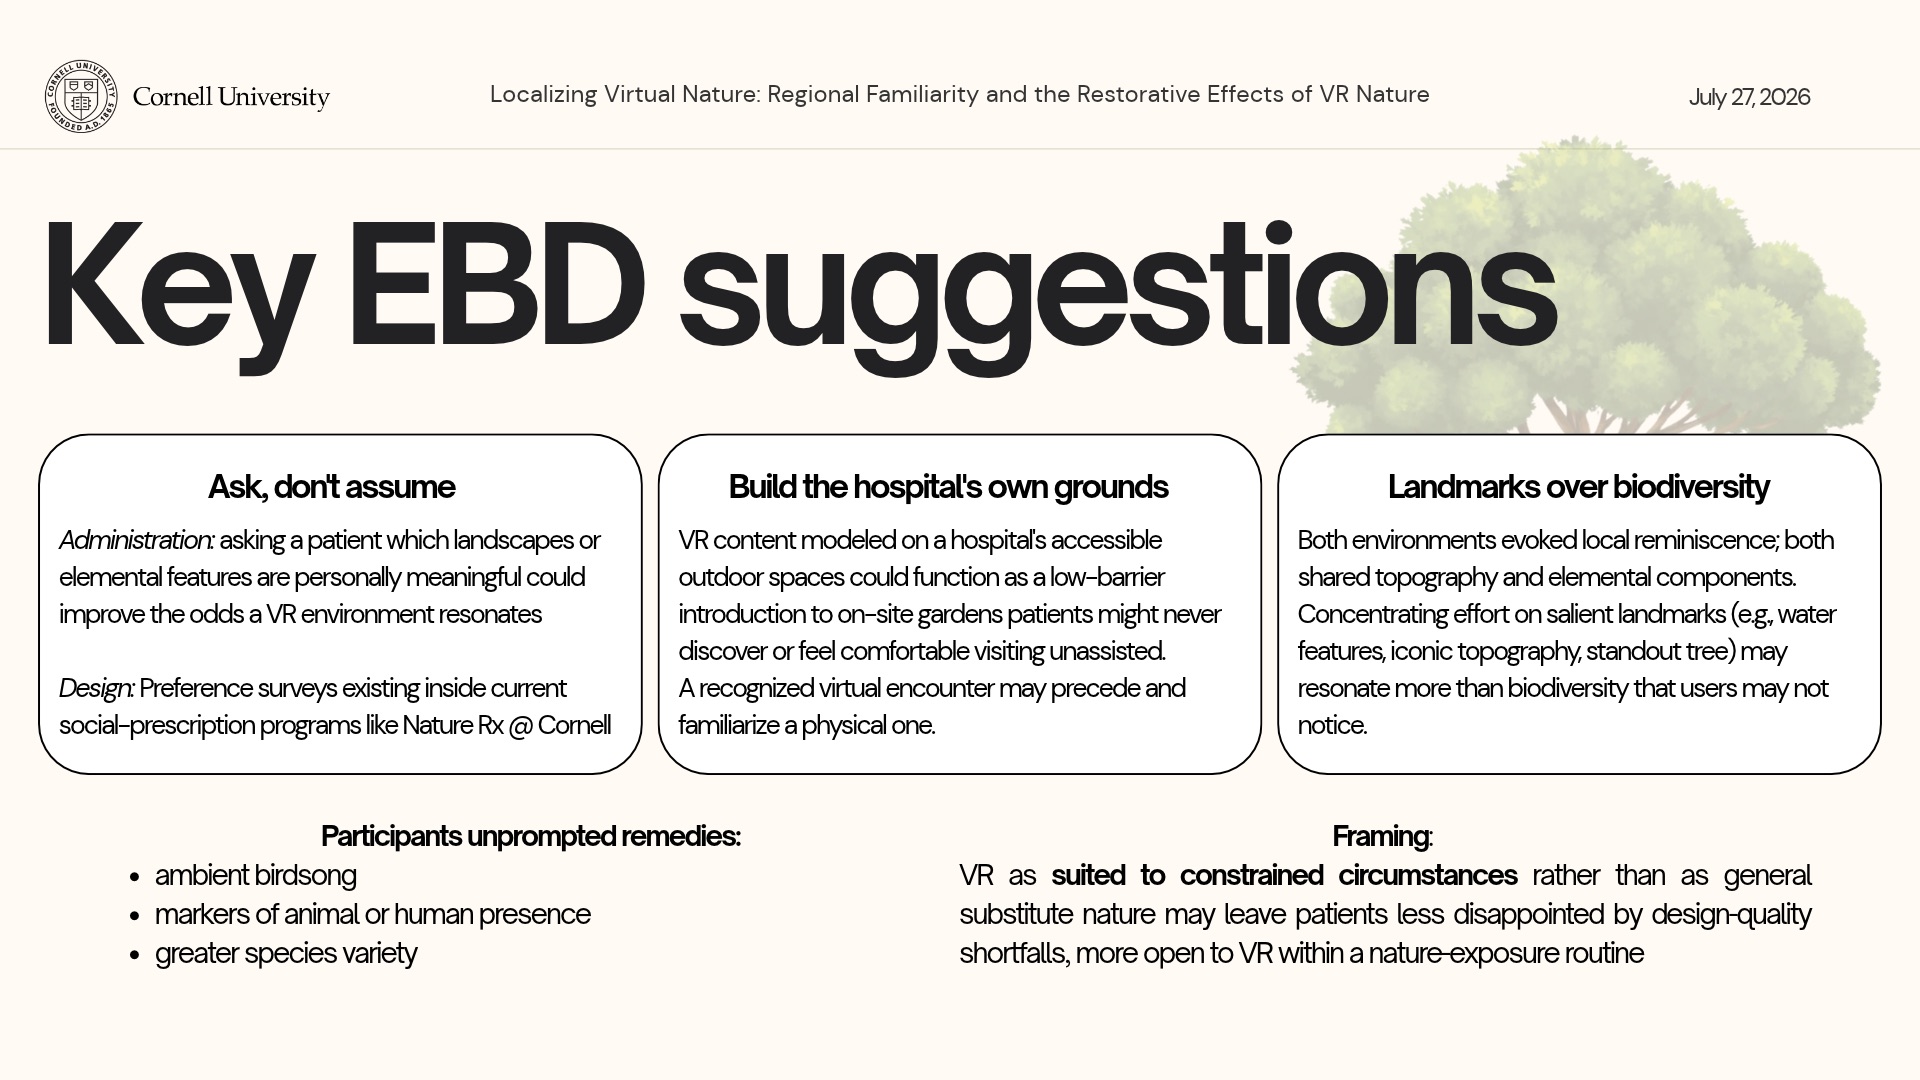
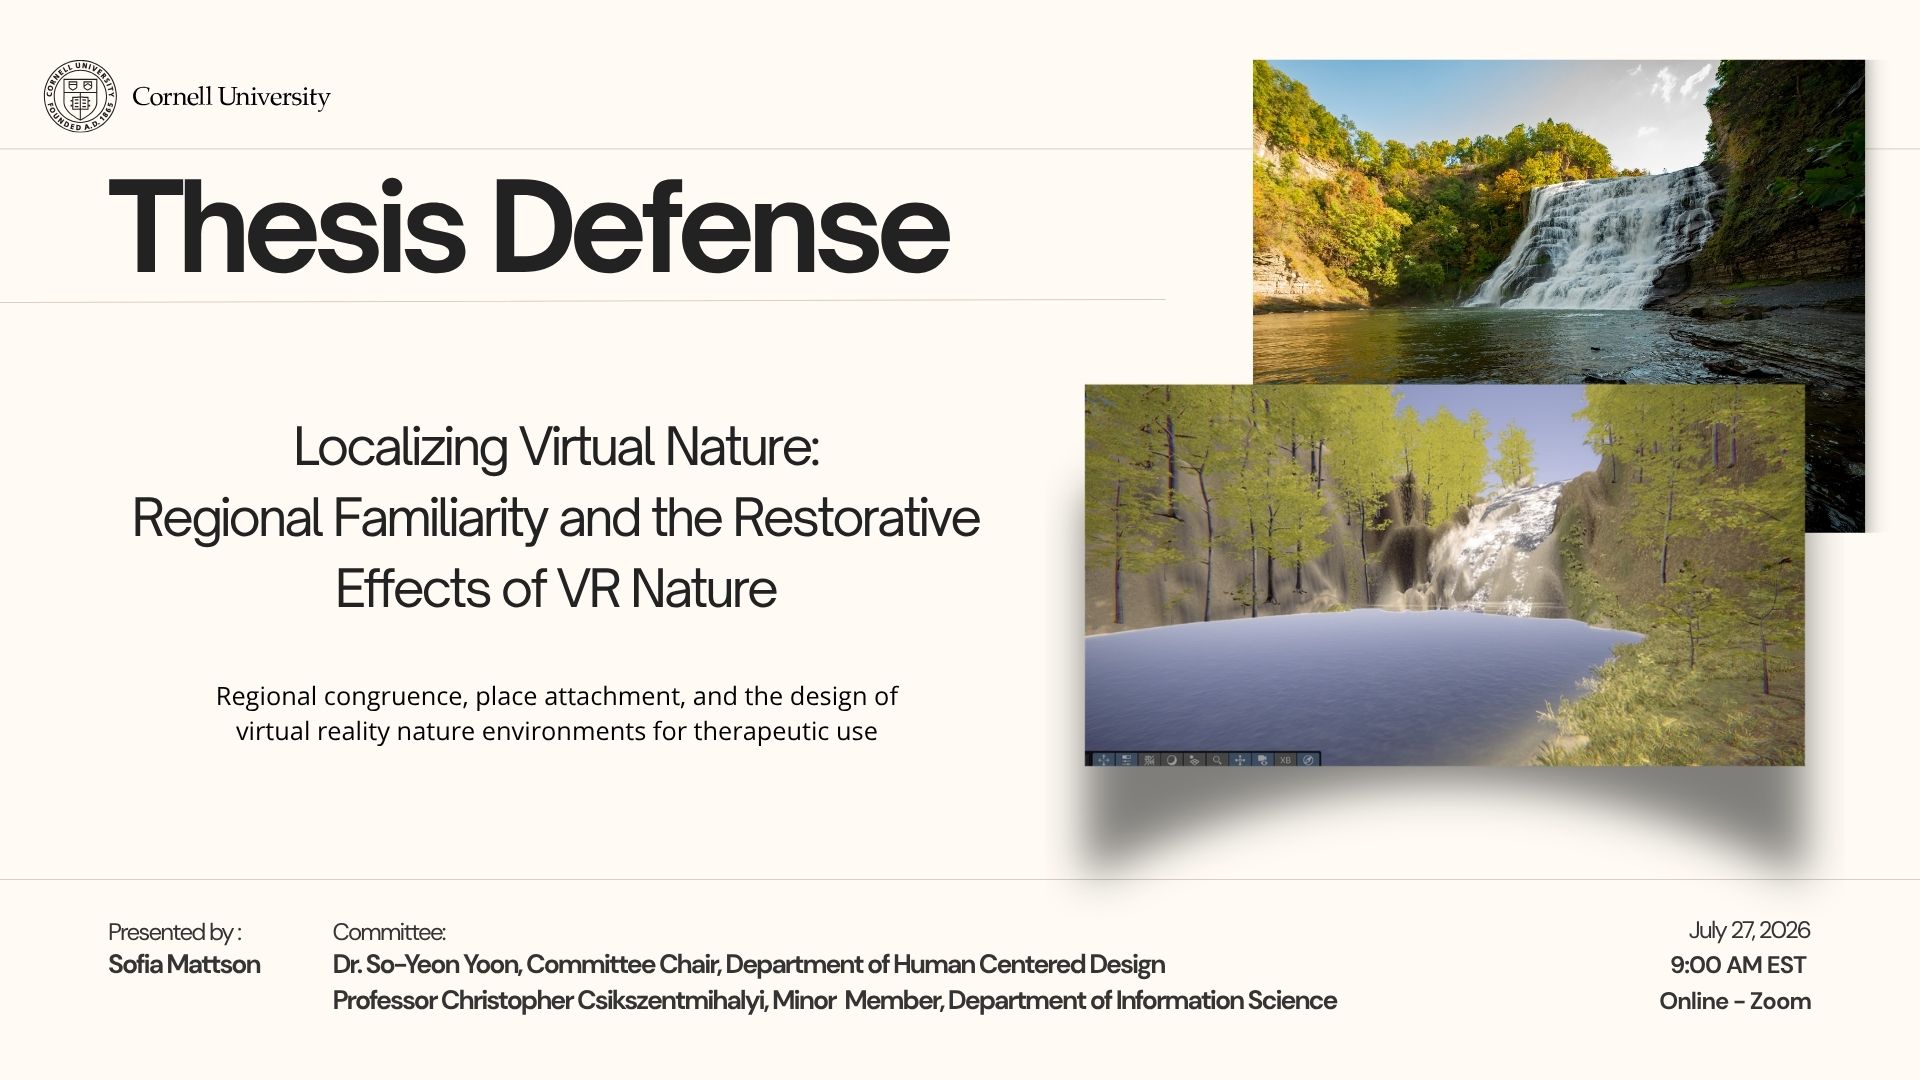
Clinical VR research treats virtual reality nature landscapes as interchangeable for therapeutic stress reduction. That means that any sufficiently green scene is assumed to restore equally, whatever the viewer's history with what's depicted. If familiarity matters, a one-size-fits-all scene library may be restorative for some patients, but not all.

02

Key Decisions

i. I matched the two environments on waterfall geometry, duration, and affordances

The two conditions: identical waterfall and creek geometry, different regional flora and color.

ii. I paired each exposure with a Stroop stressor

iii. I restricted the primary analysis to first exposures

Analytic pivot: participants referred to their first environment during the second, so the primary analysis used first exposures only.

03

Outcome

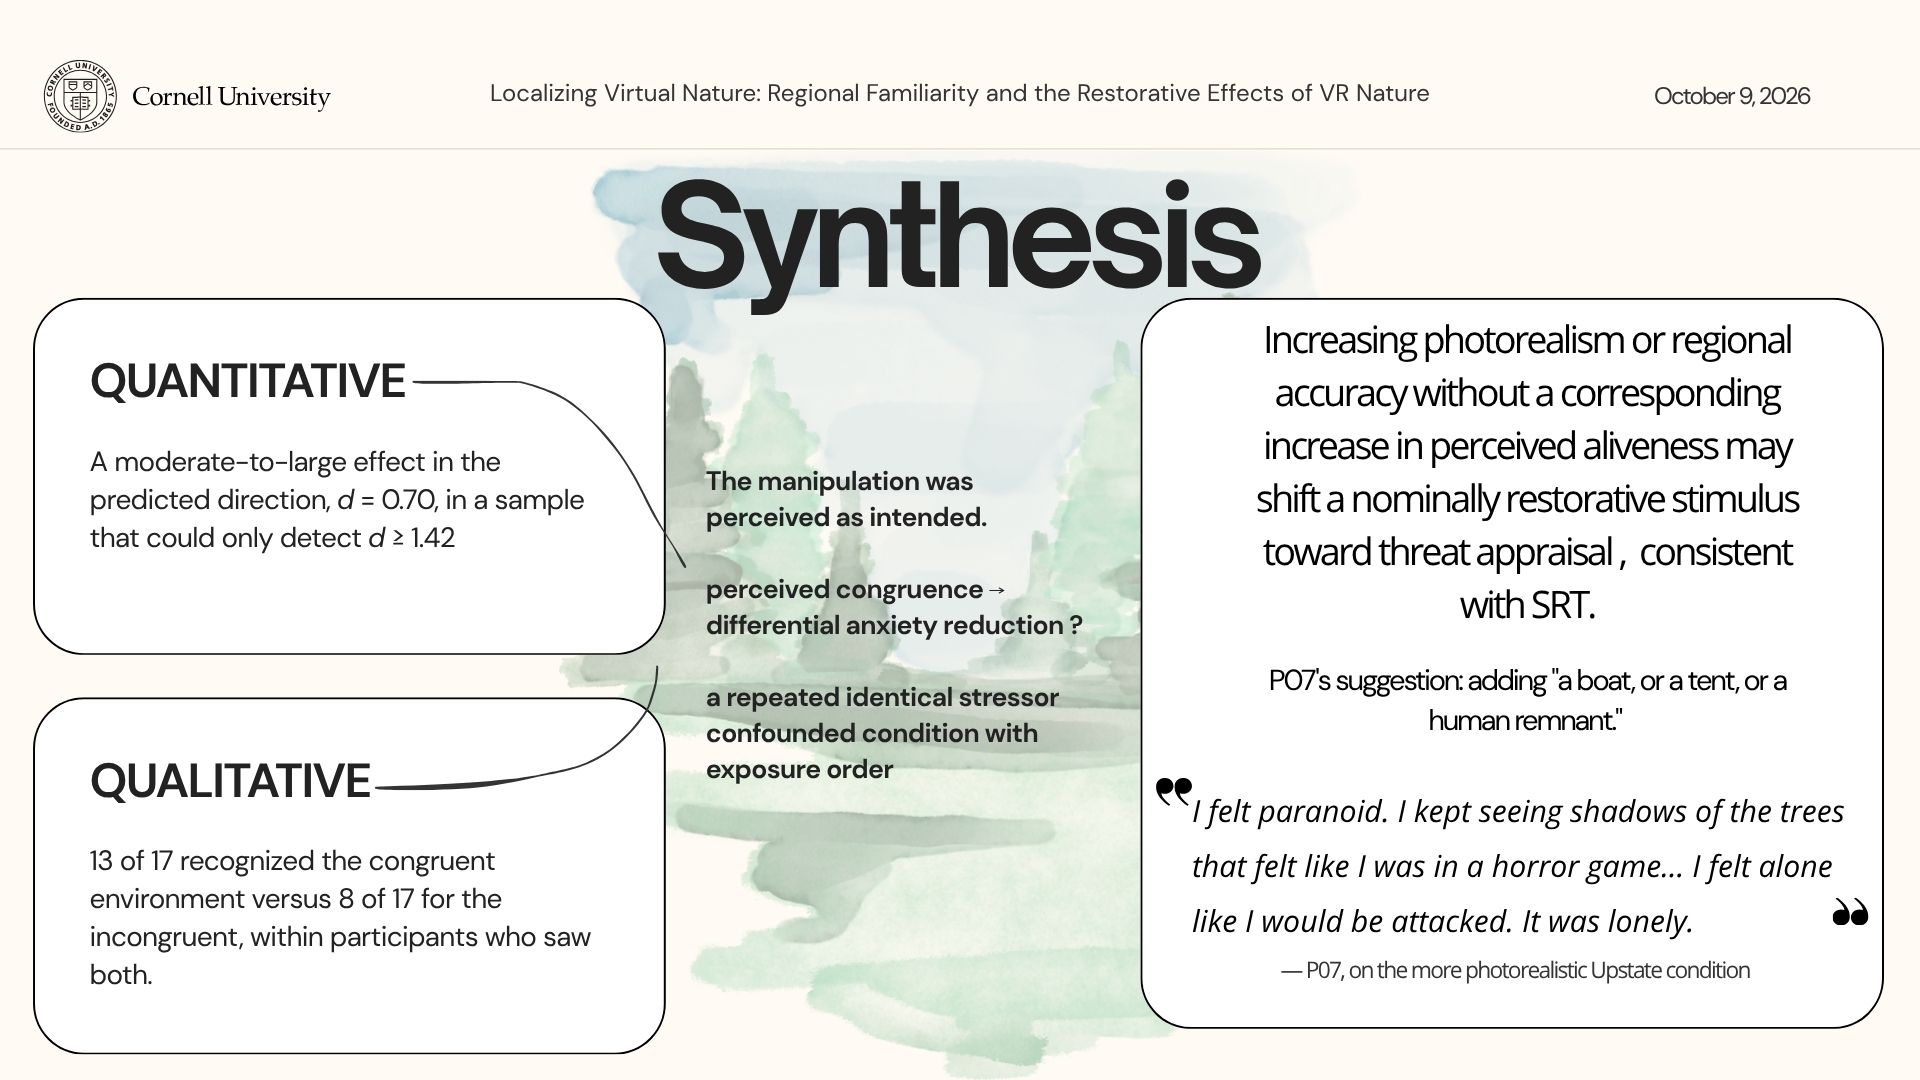
Anxiety fell further after the congruent environment (−8.40 vs −3.62 STAI-S, d = 0.70) — the predicted direction at a moderate-to-large effect, non-significant in an underpowered sample.


Thematic analysis of 17 semi-structured interviews found asymmetric place recognition (13 versus 8 participants) alongside a near-universal critique of ecological sparseness. Regional congruence was perceived as intended but could not be isolated; an adequately powered replication requires approximately 68 participants.

01

The Challenge

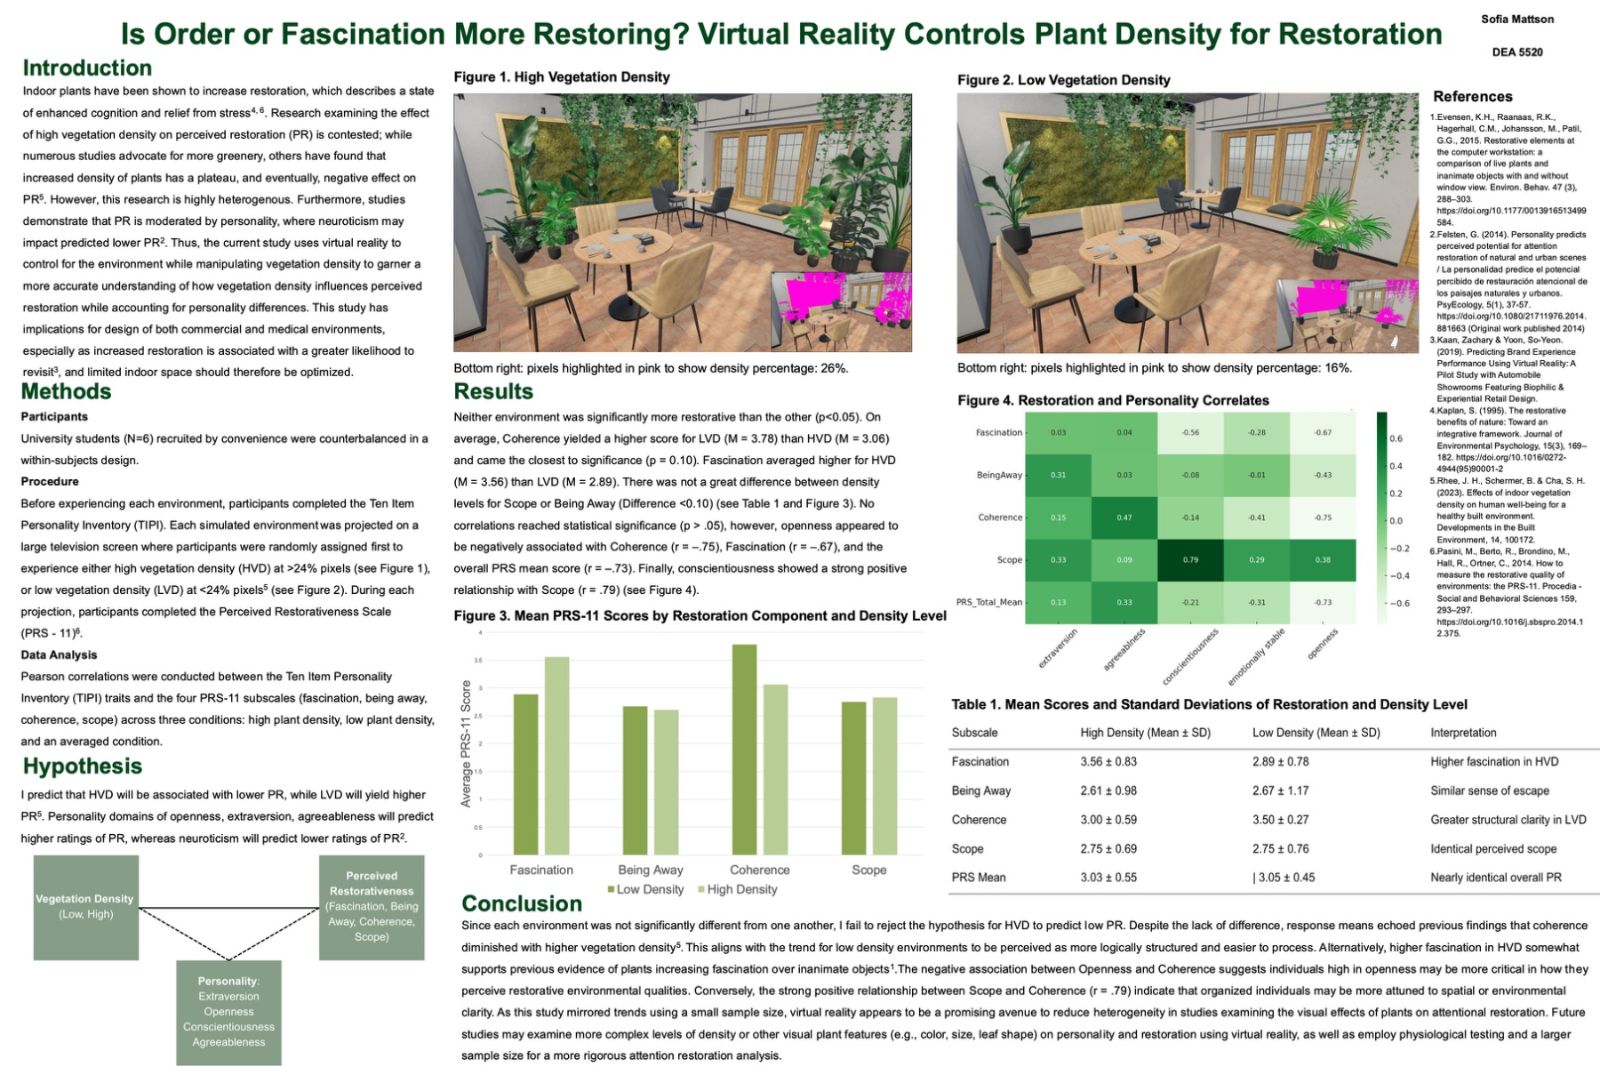
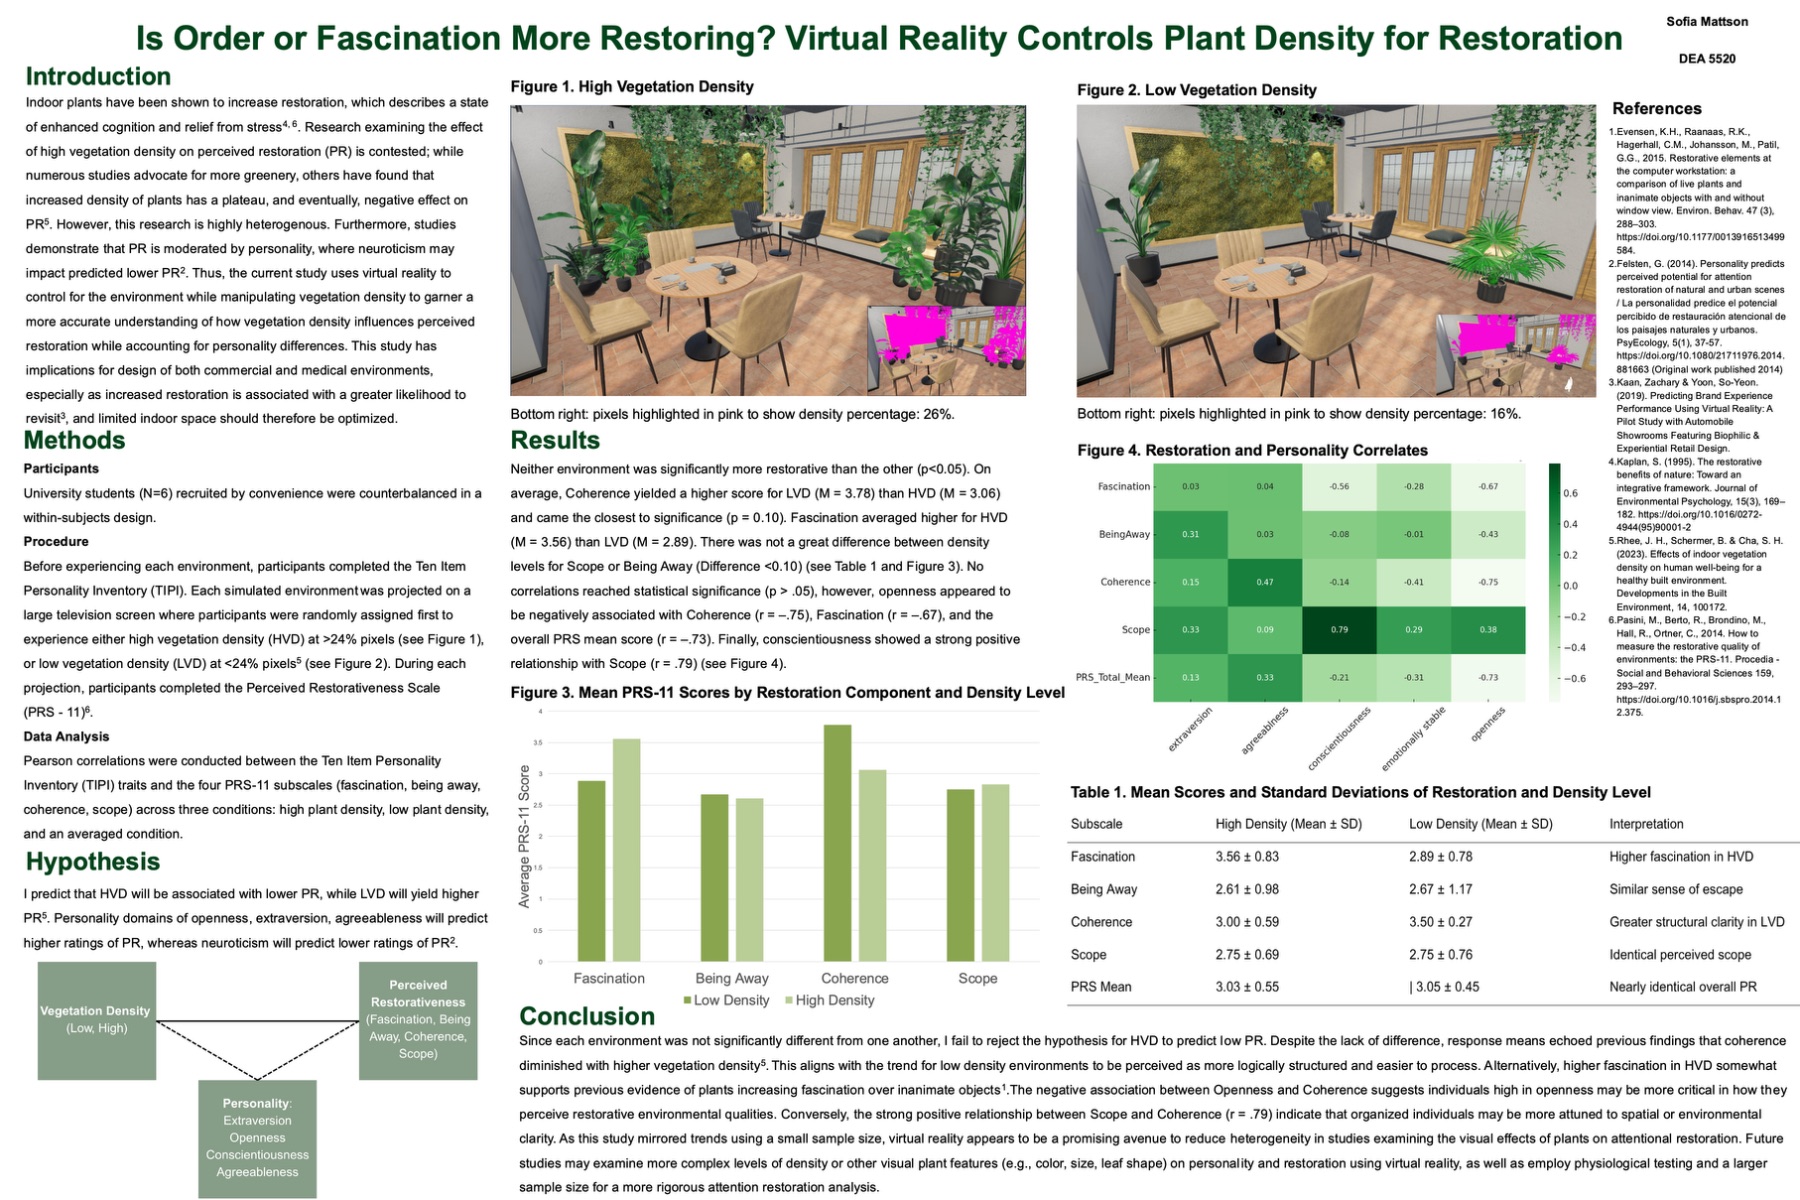
Advice on interior planting is contested — more greenery is usually better, until it isn't. Neuroticism and openness are known to influence perceived restoration ratings, so the same room may not restore everyone equally.

02

Key Decisions

i. I used VR to hold the interior constant and vary only vegetation density

ii. I measured personality alongside restoration

03

Outcome

Neither environment was significantly more restorative. Coherence ran higher in low density (3.78 vs 3.06, closest to significance at p = .10) while fascination ran higher in high density (3.56 vs 2.89) — order and interest pulling against each other. Openness tracked negatively with coherence (r = −.75).

01

The Challenge

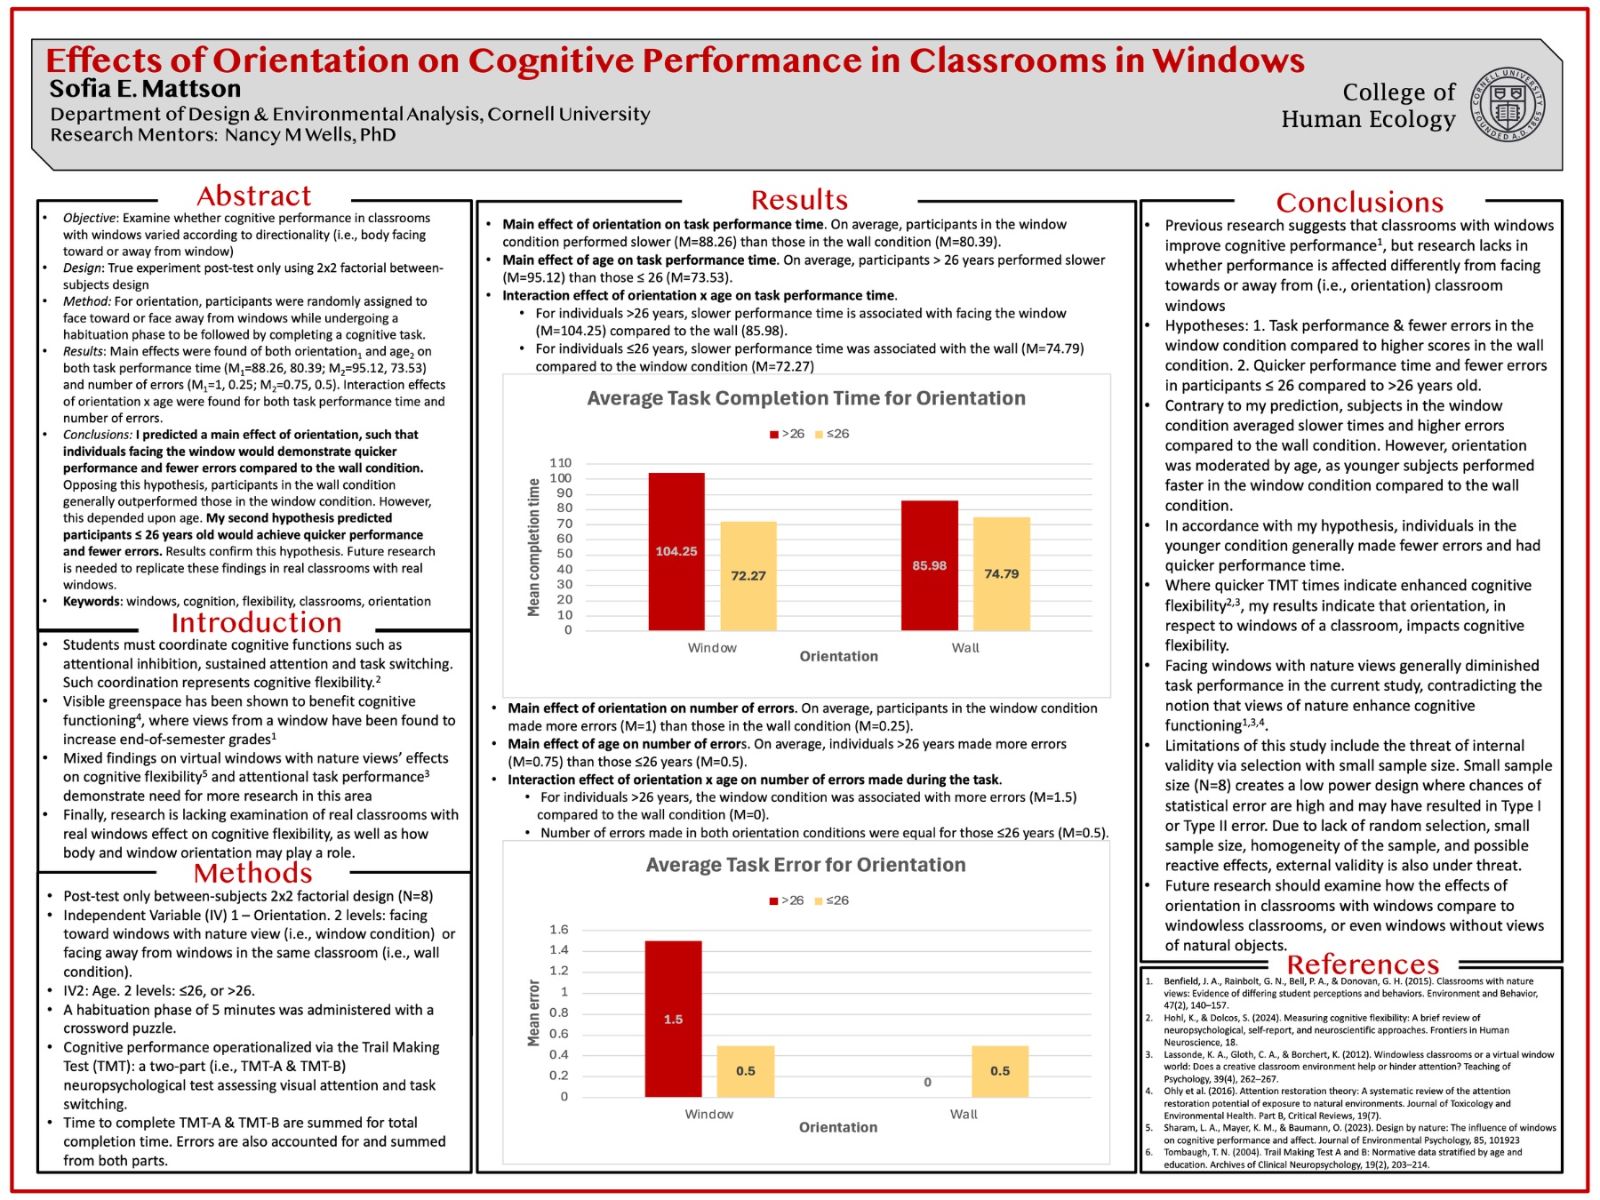
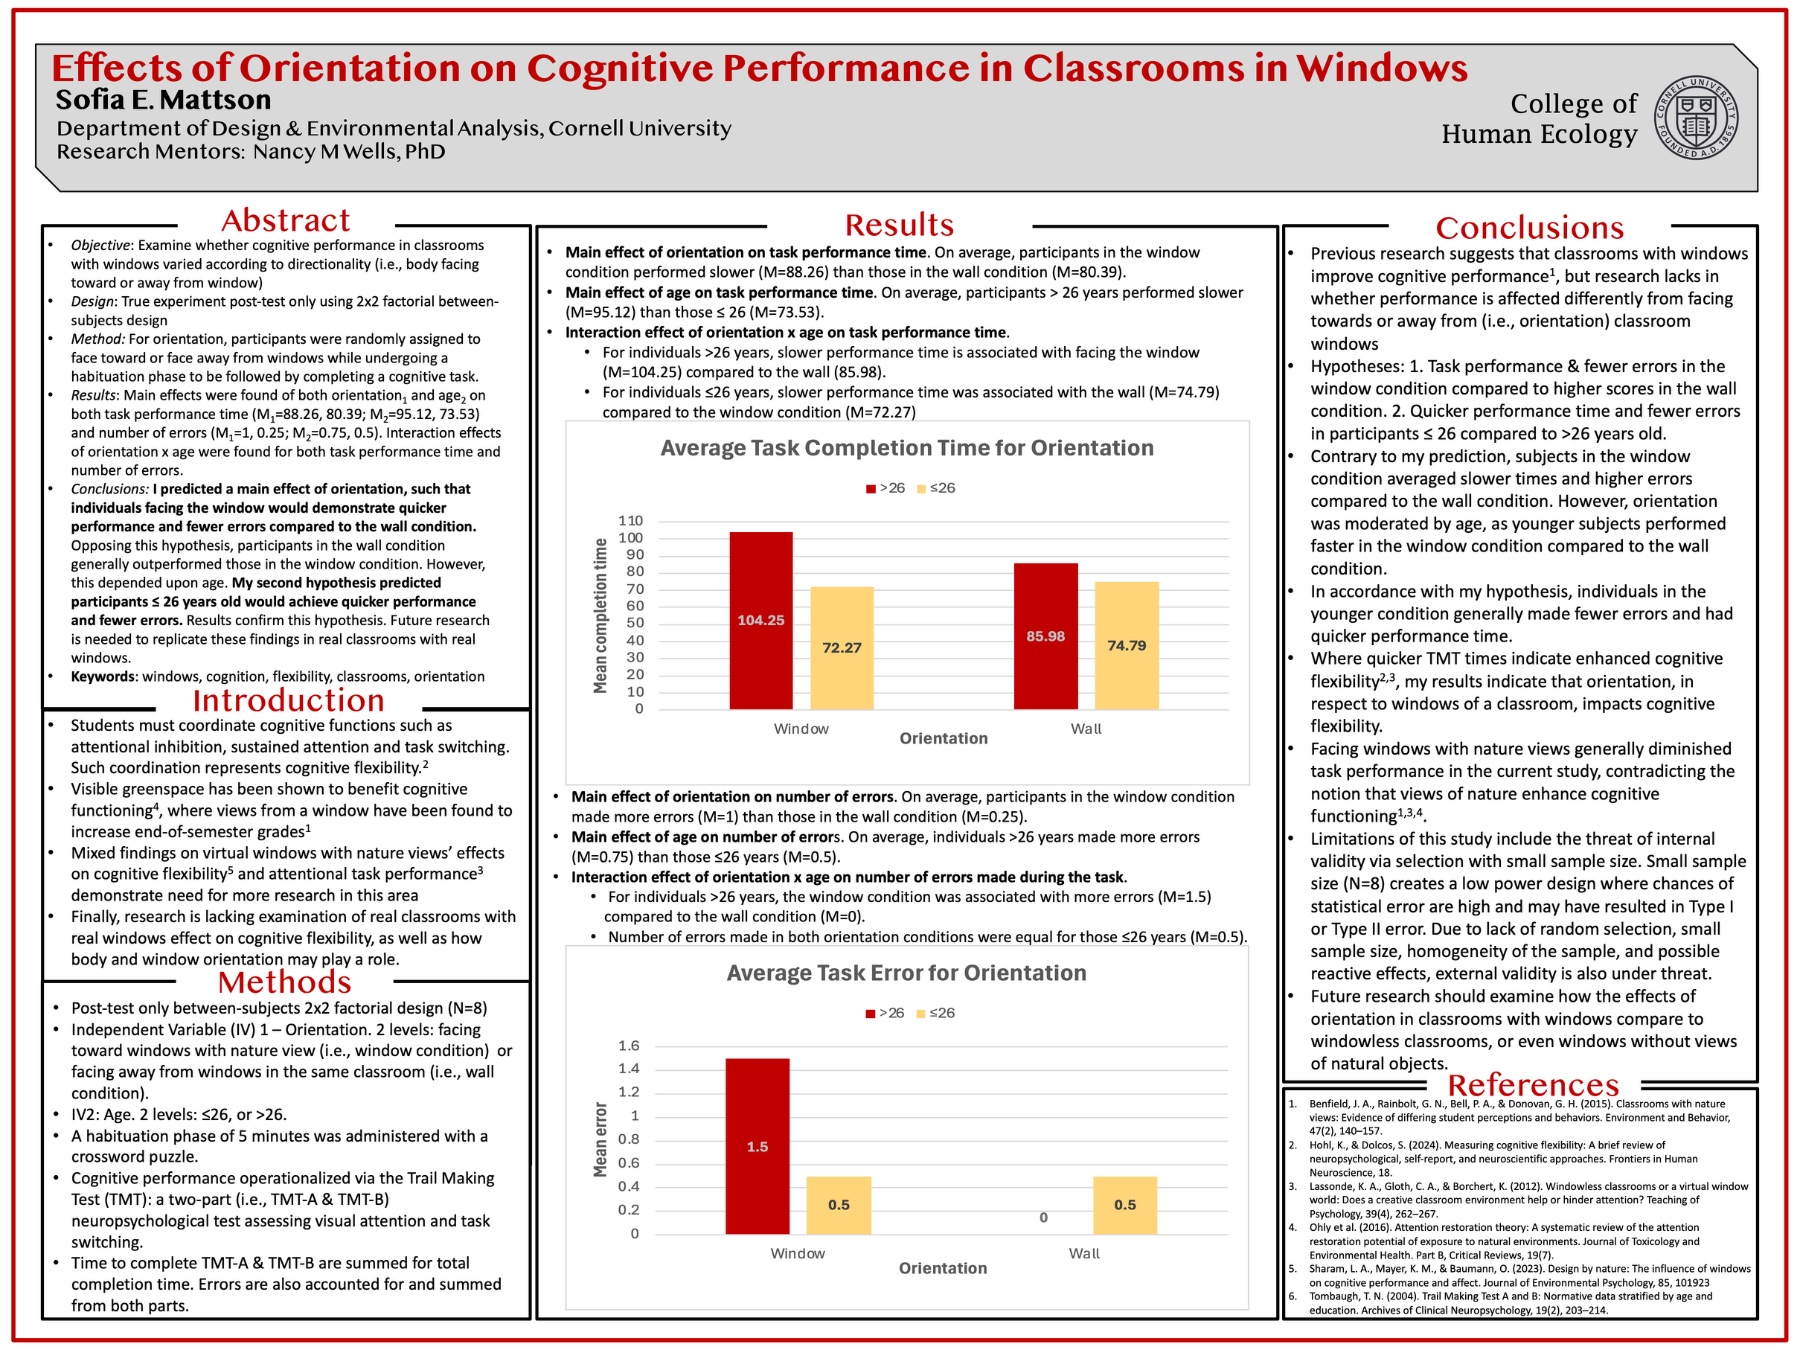
Classrooms with windows viewing nature are known to help cognitive performance. Evidence is lacking for where windows are placed and students are faced. In other words, can students better concentrate when they face towards or away from the windows?

02

Key Decisions

i. I used the same classroom and changed which way participants faced

ii. I crossed orientation with age

03

Outcome

Against prediction, facing the window was slower on average (88.26 s vs 80.39 s) with more errors. Age moderated it: under-26s were slightly faster facing the window (72.27 s vs 74.79 s), while over-26s were markedly slower (104.25 s vs 85.98 s). At N = 8 this is a signal to replicate, not a result to act on.

Usability evaluation / Google Maps

Maps is for drivers and passengers.

We built a custom evaluation to test how well Google Maps helps drivers and passengers find parking in unfamiliar places.

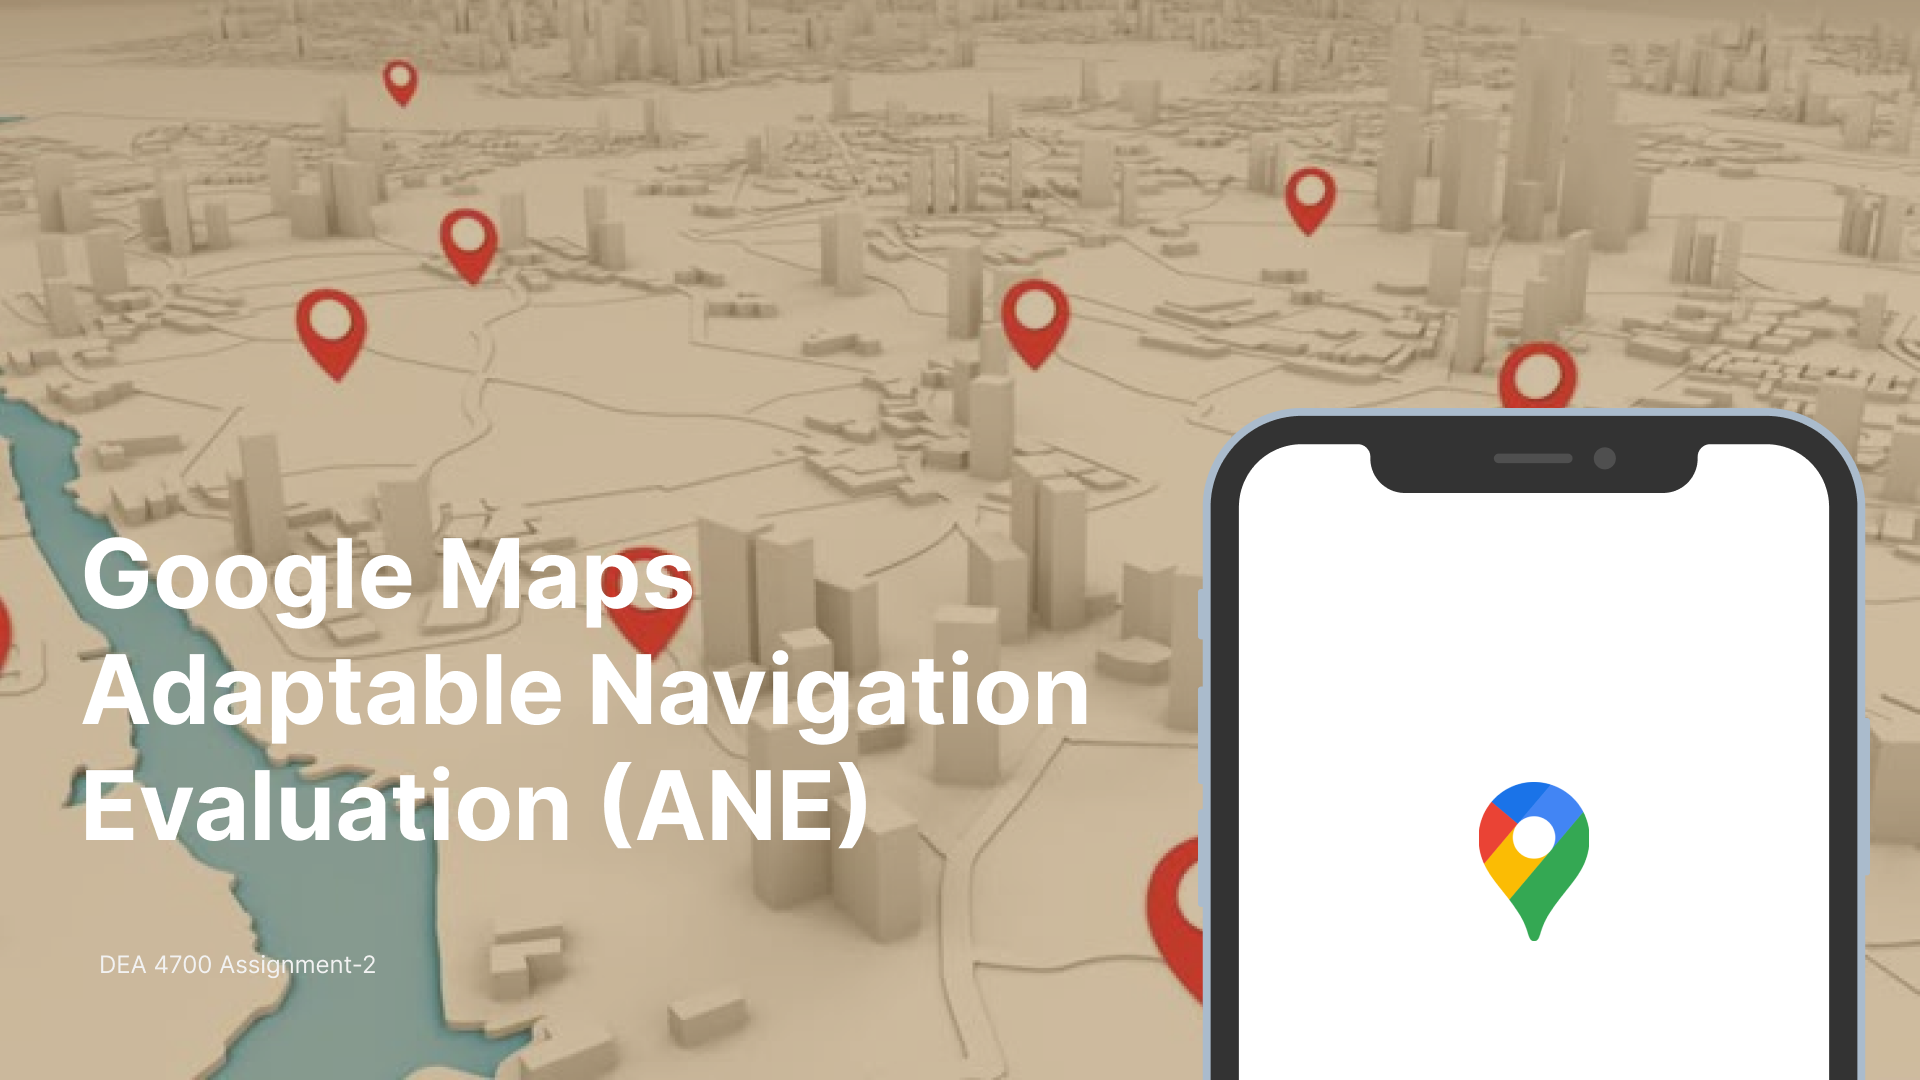
Workbook cover: a map with red pins beside a phone showing the Google Maps logo
Role
Graduate student lead
Team
Sofia Mattson, Eric Taewoo Kim, Shelly Jingze Wang, Yucheng Shu
Context
DEA 6700, Cornell University
Methods
Custom heuristics, Likert scoring, role-based pilot

Different roles underscore different usability; Same step-by-step process.

Passengers
71%
Drivers
55%

Mean usability score. Small pilot of 3 drivers and 3 passengers, so results are directional.

The route we took

  1. 01

    Frame the task

    Find parking near an unfamiliar destination, tested from each seat.

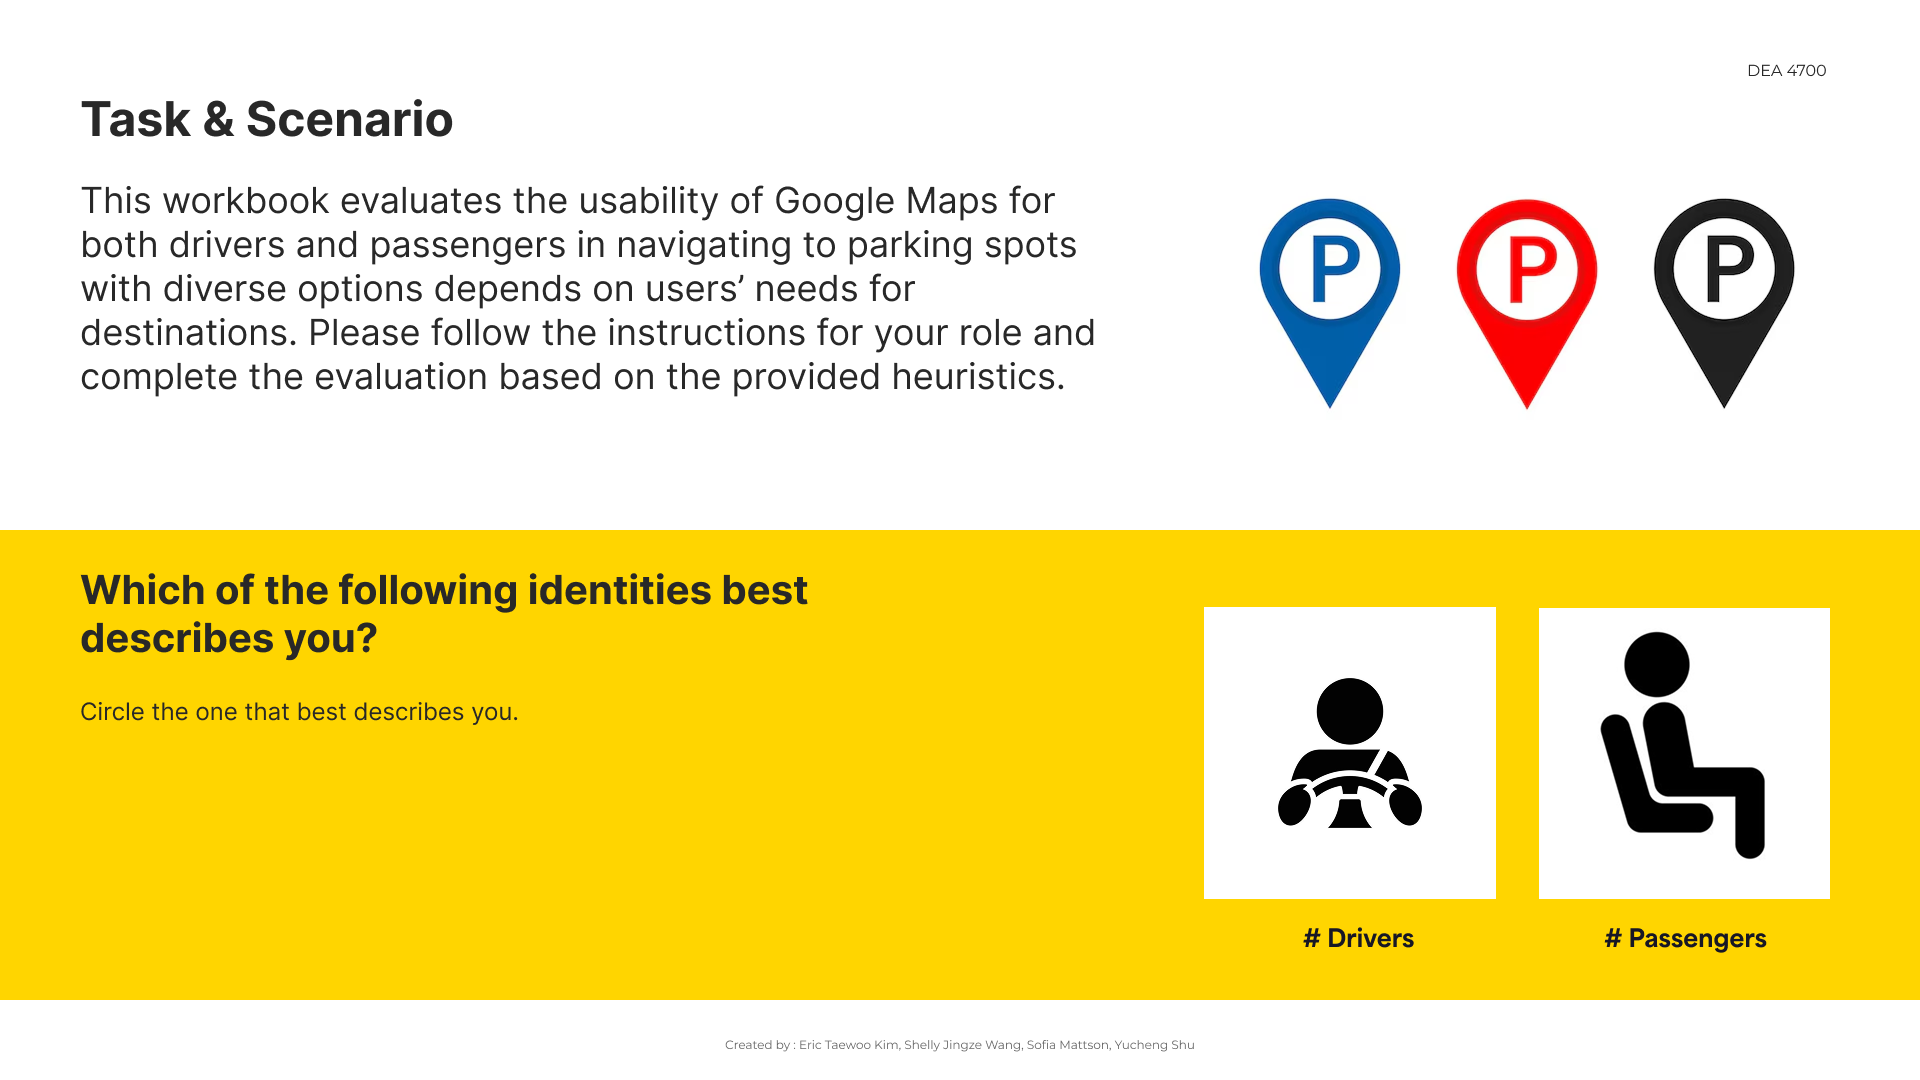
    Workbook page describing the task and asking evaluators to identify as a driver or passenger
  2. 02

    Define what to measure

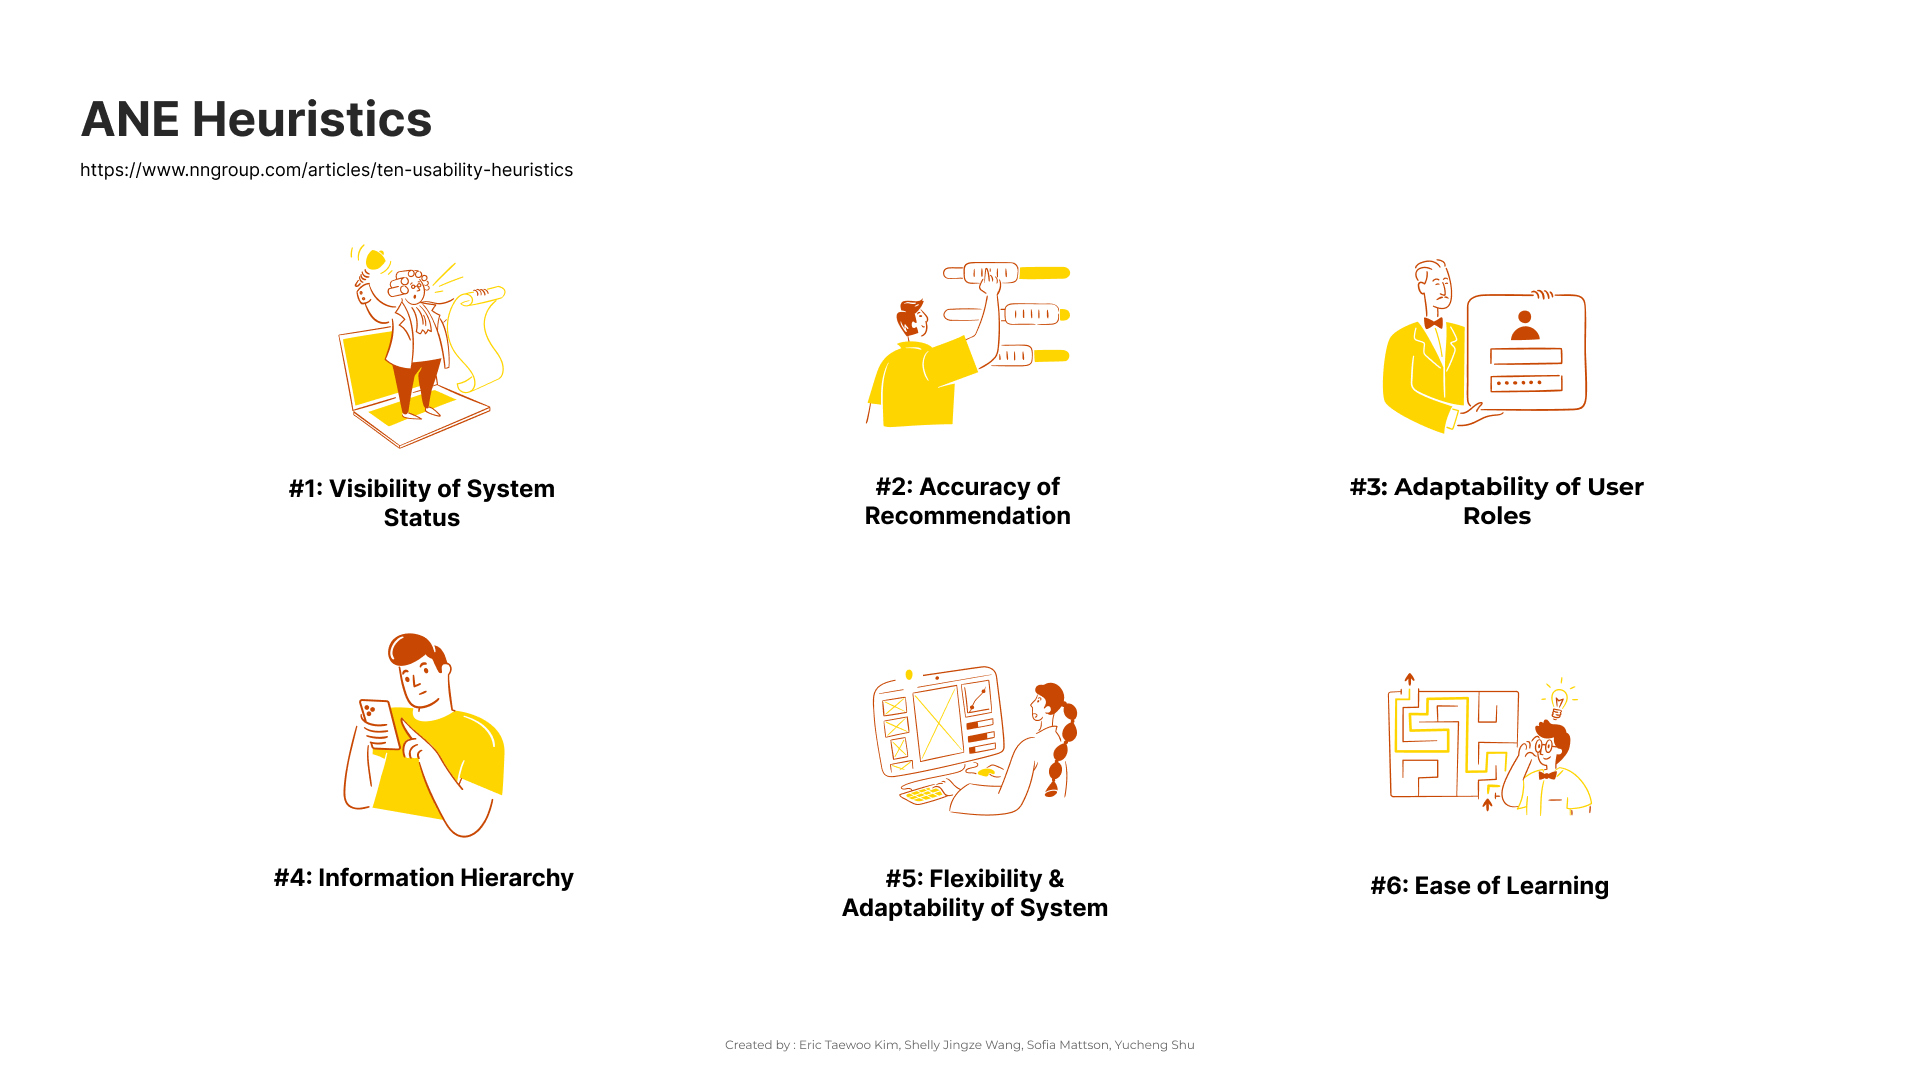
    Six custom heuristics, drawn from Nielsen's heuristics and the System Usability Scale.

    Six illustrated heuristics: visibility of system status, accuracy of recommendation, adaptability of user roles, information hierarchy, flexibility and adaptability of system, ease of learning
  3. 03

    Split the path by role

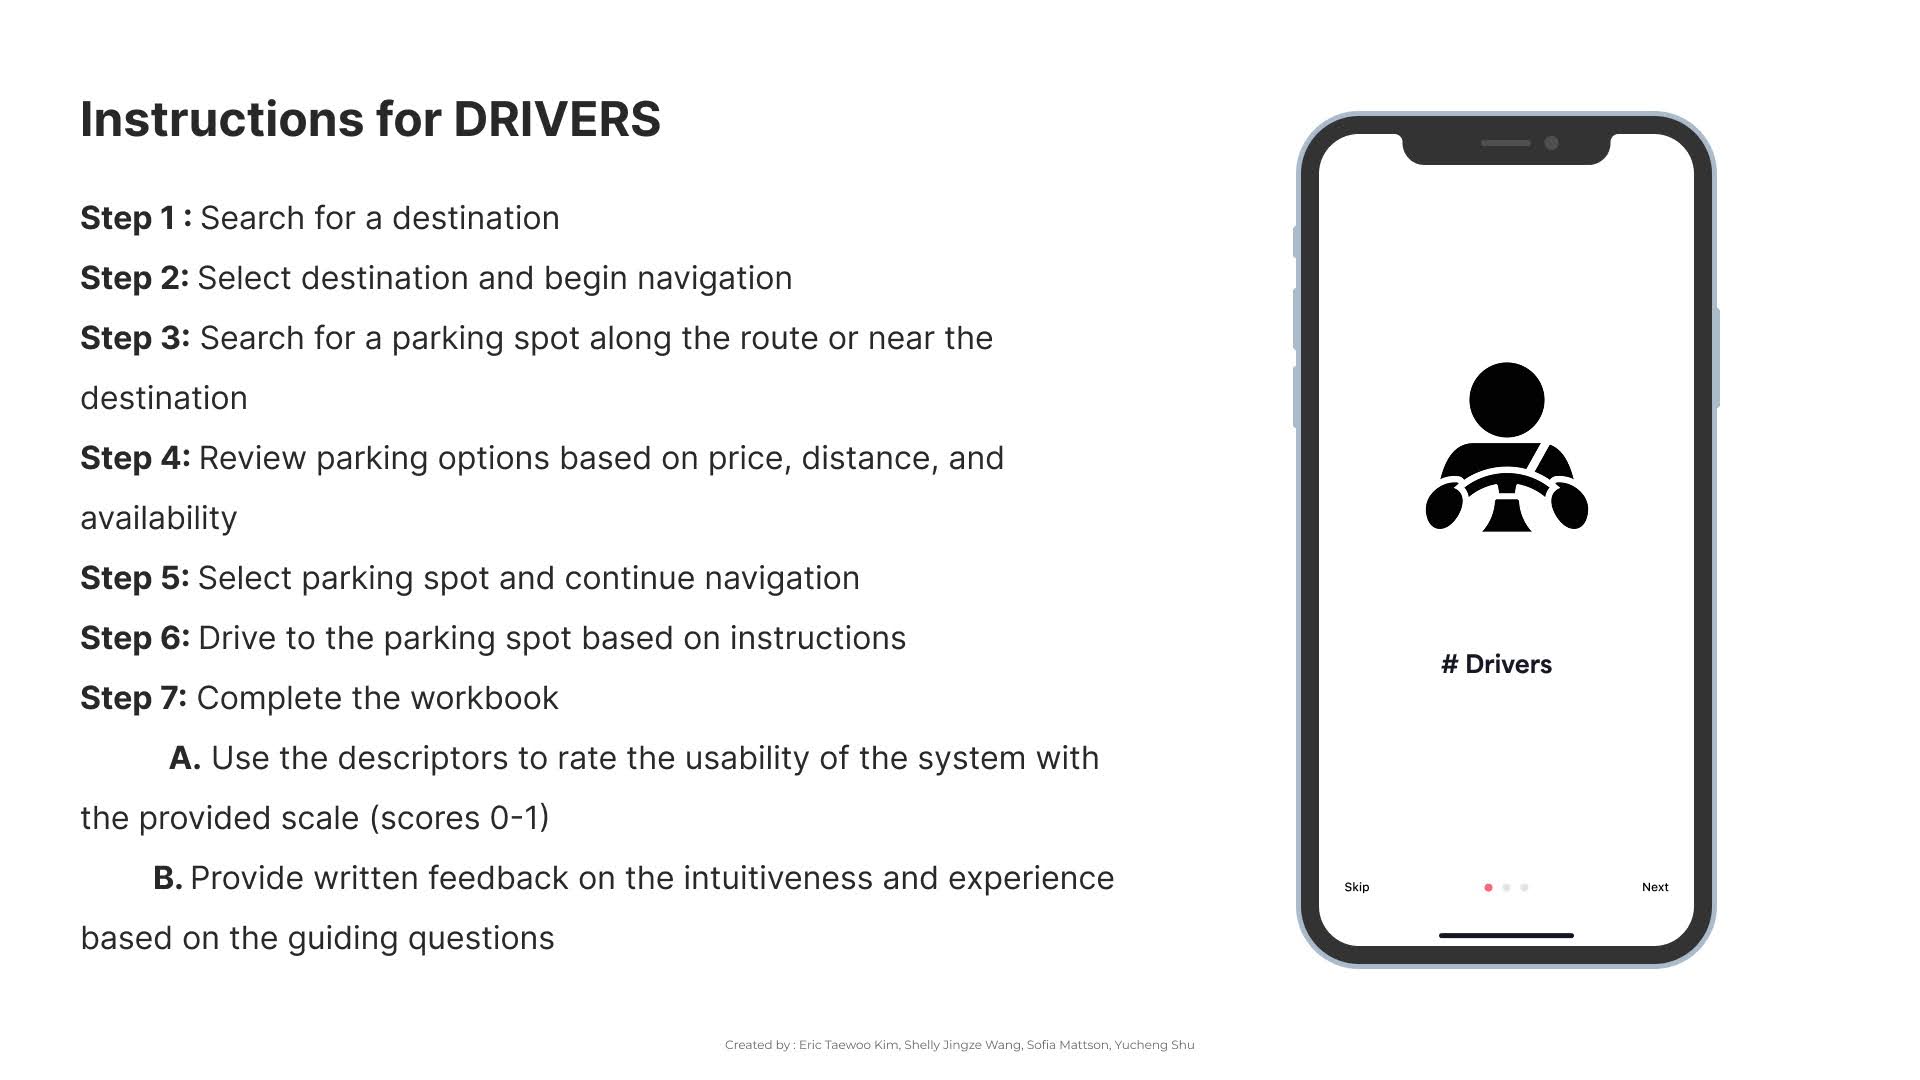
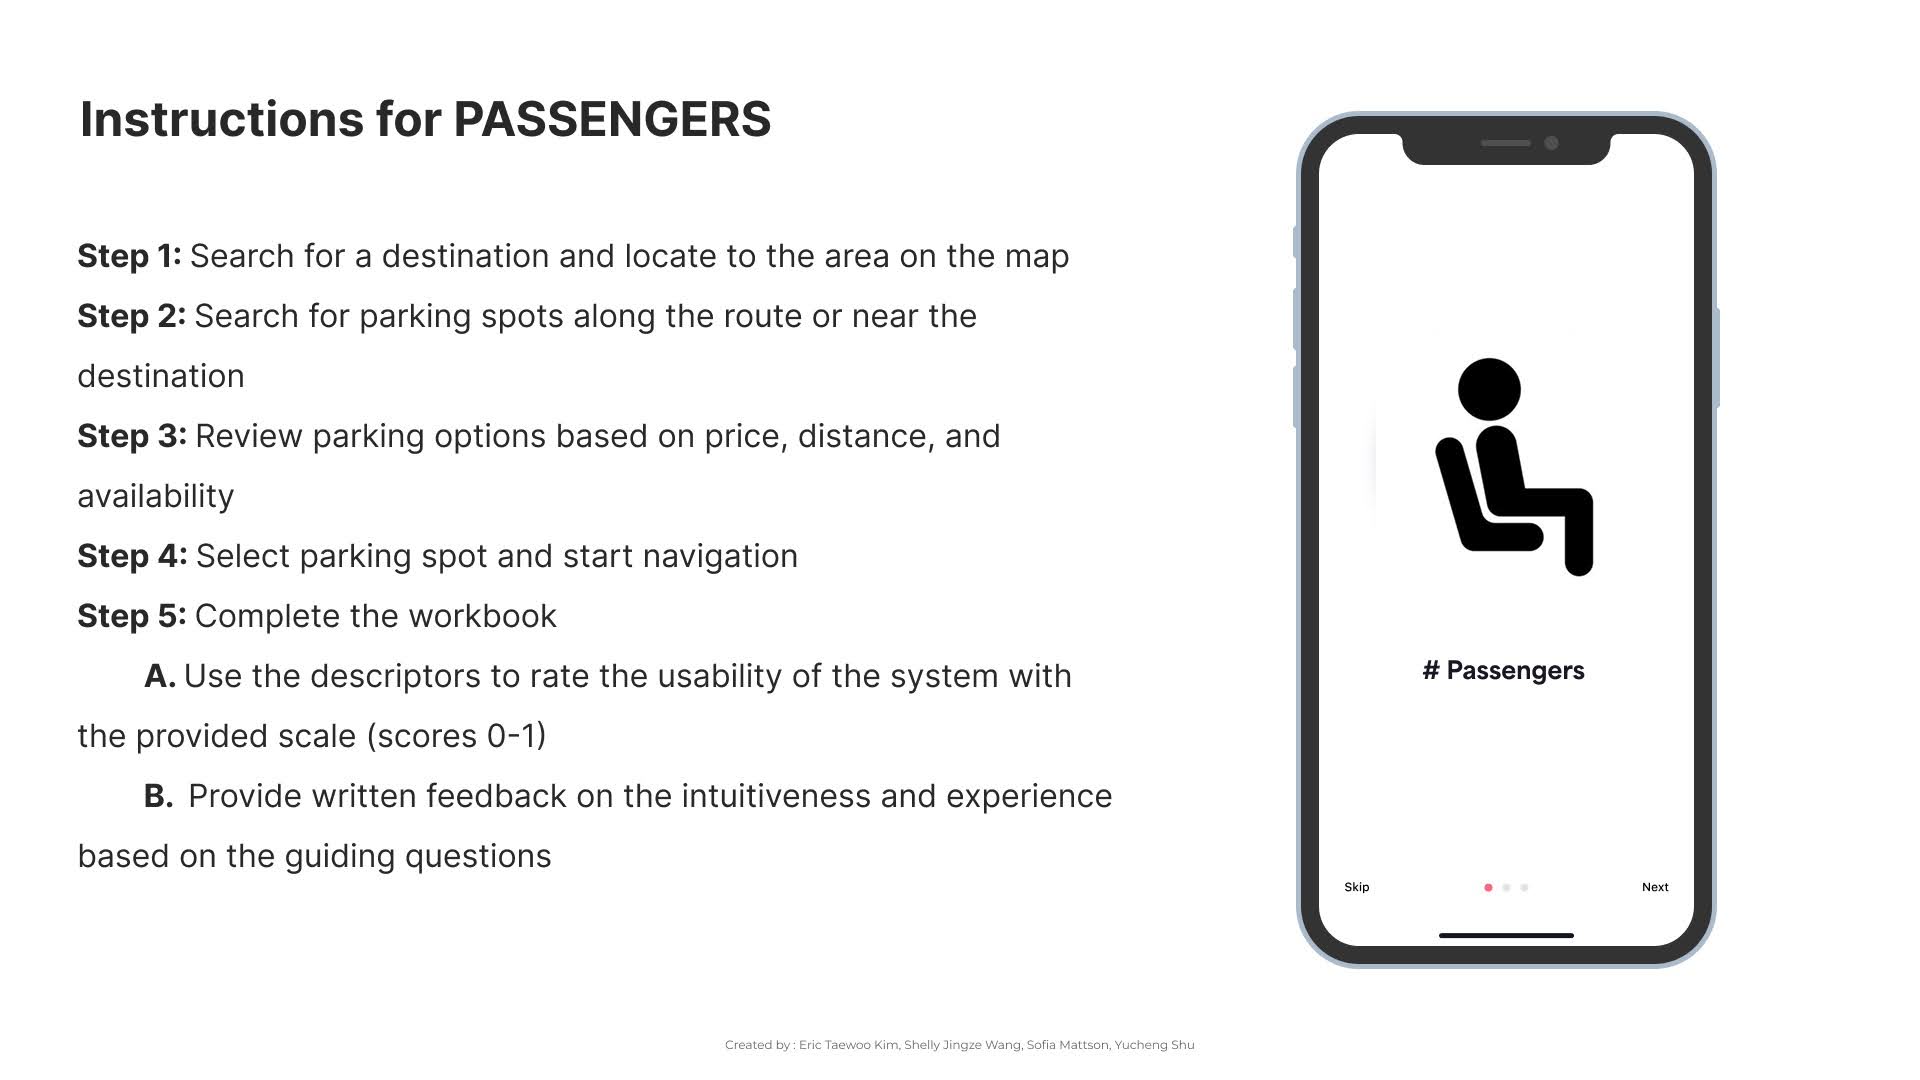
    Each role follows its own steps, then scores the same 16 items.

    Step-by-step workbook instructions for drivers Step-by-step workbook instructions for passengers
  4. 04

    Design the scoring

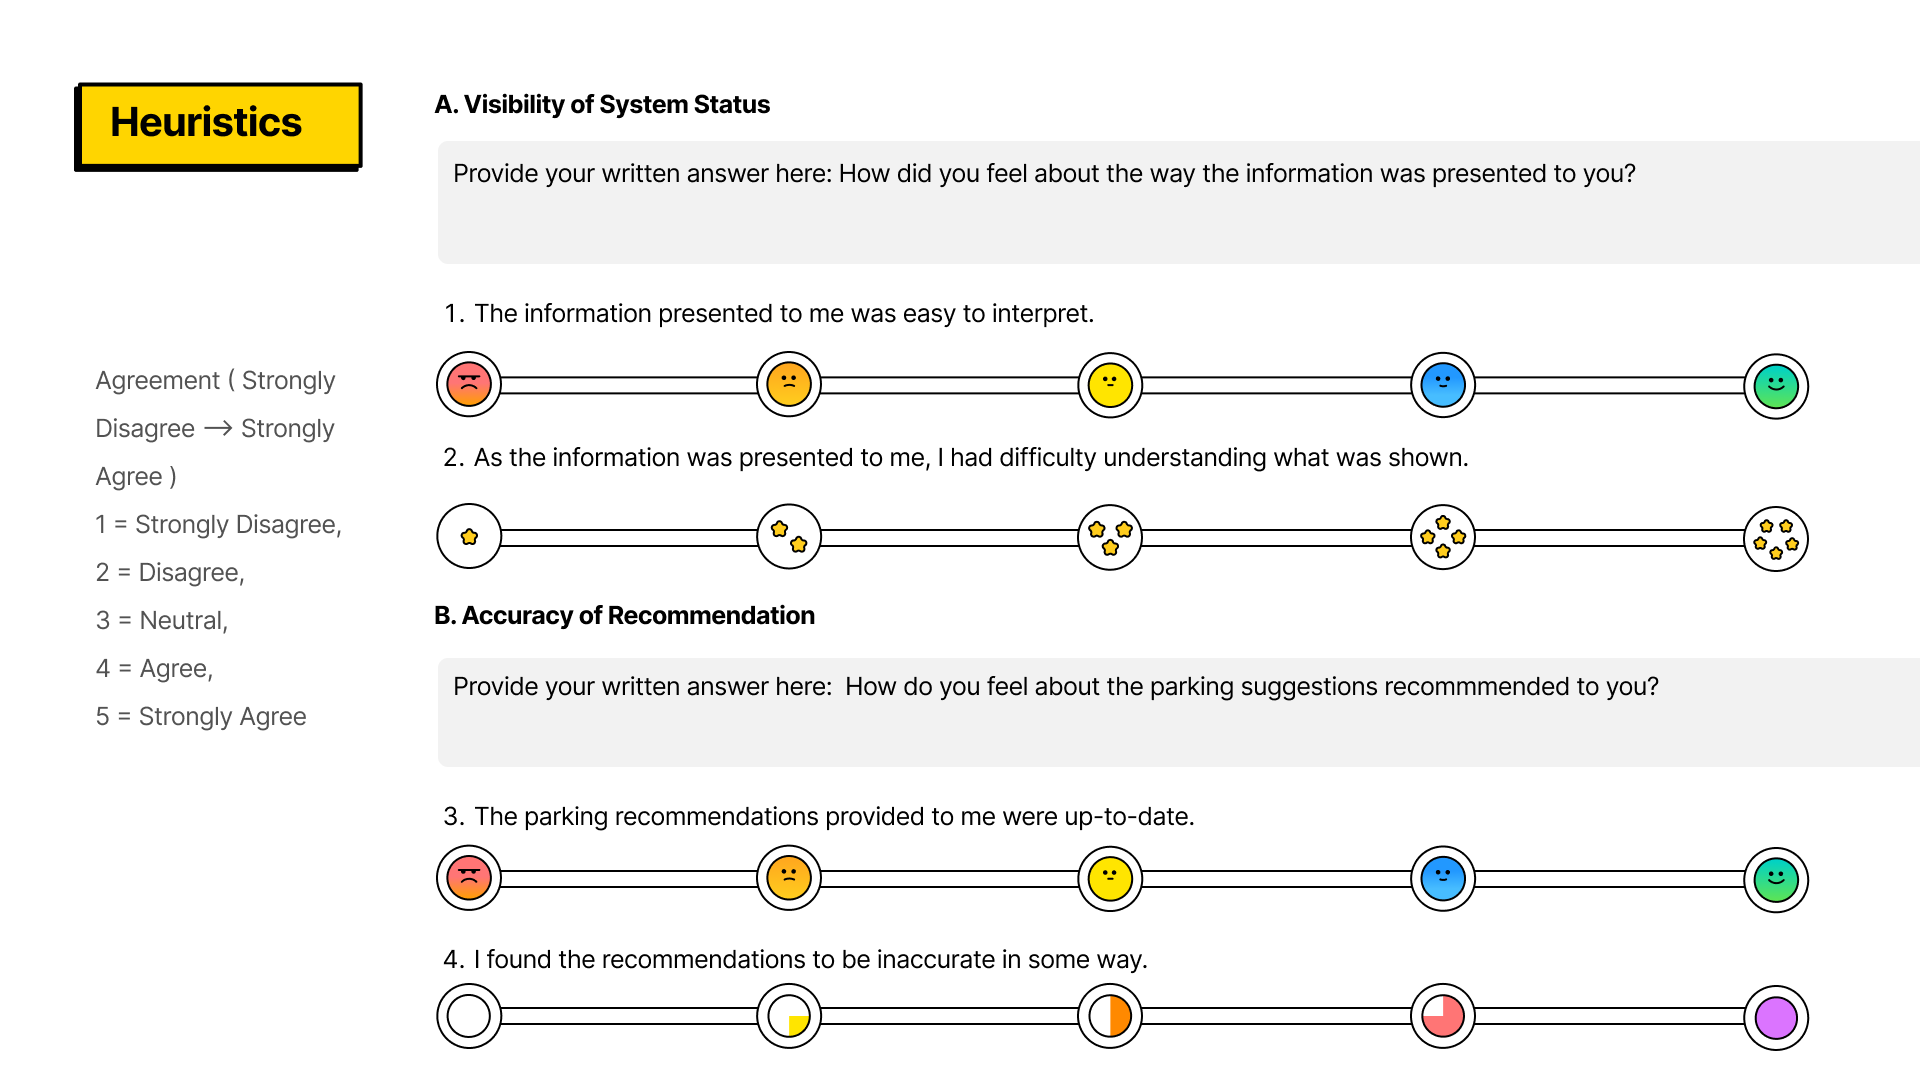
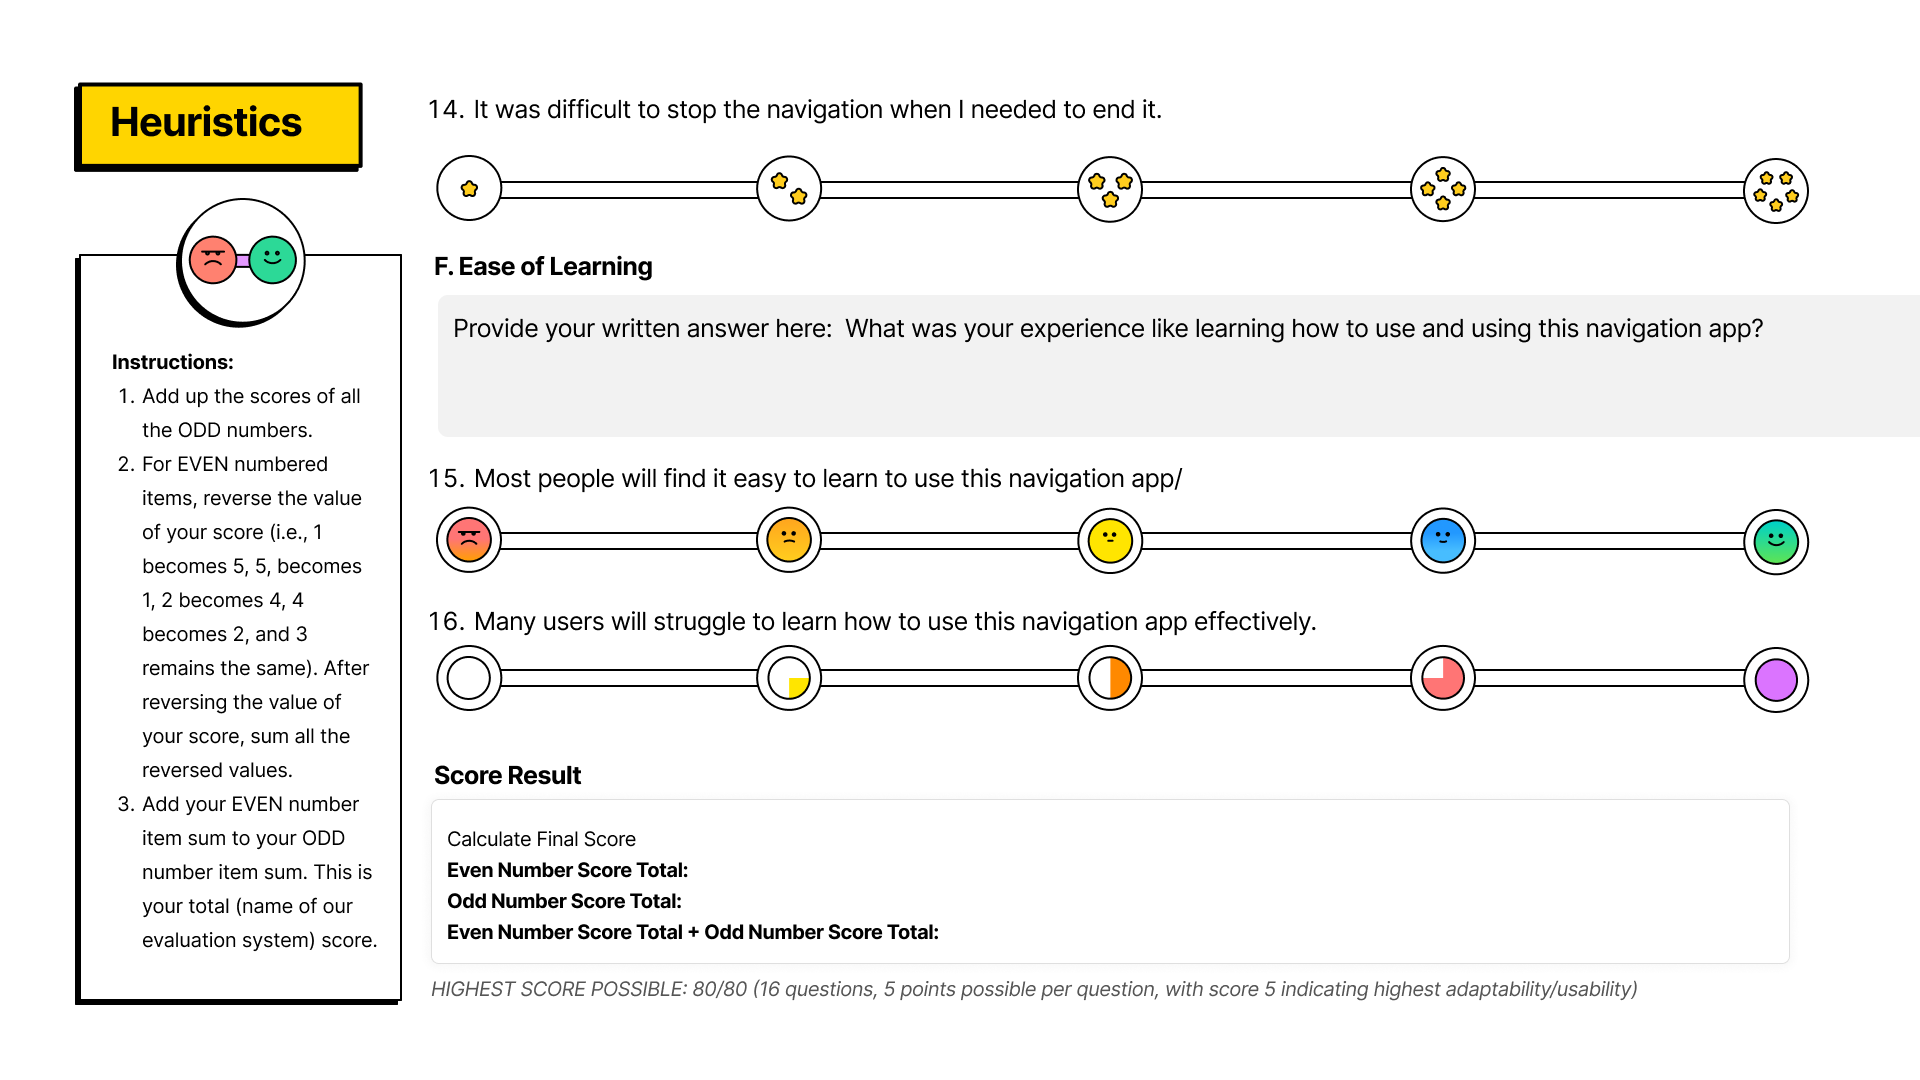
    Open questions plus 1–5 ratings. Negative statements are reverse-scored to reduce response bias.

    Workbook page with open-ended prompts and rating scales Workbook page with scoring instructions and a total out of 80
  5. 05

    Pilot it

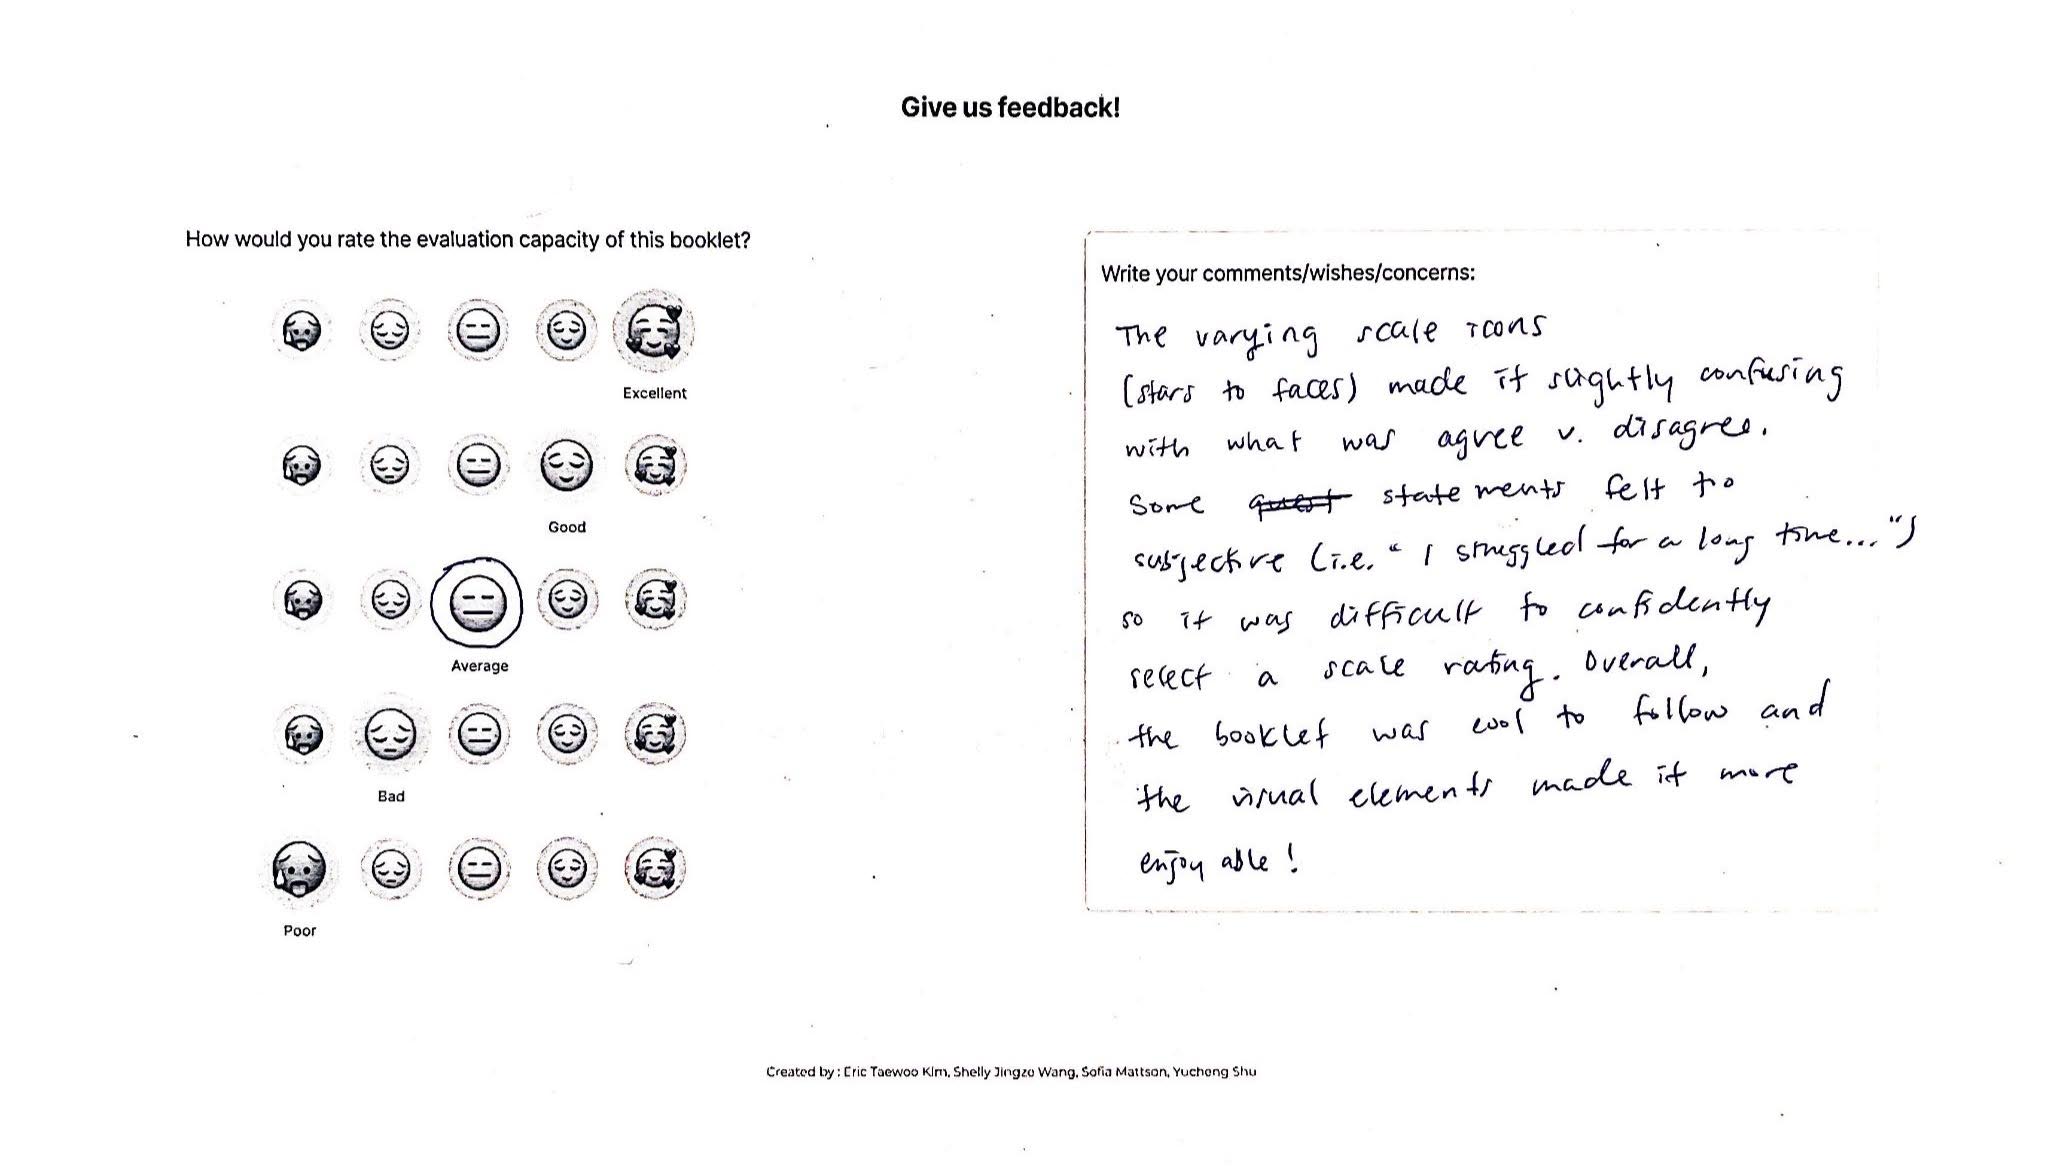
    We tested each role separately. For realism, drivers searched for parking while driving. Evaluators then rated the workbook too.

    A completed feedback page with an evaluator's rating and handwritten comments

The biggest split: adding a parking stop mid-route

Passengers Drivers Mean agreement, 1 (strongly disagree) to 5 (strongly agree)

"I could easily add a parking destination onto my chosen route."

3.0
1.3

"I struggled for a long time with adding a parking stop to my route."

2.7
4.7

"Many users will struggle to learn how to use this navigation app."

1.3
4.0
"I couldn't find the option of adding parking as a stop."
Hidden action / Driver
"There is too much information."
Attention overload / Driver
"Changing the route can be scary."
Rerouting anxiety / Passenger

We tested our evaluation tool, too.

3 / 5

Evaluators called the design "playful and visually appealing." They also found it redundant, and the rating icons confusing.

In the future, we would benefit from using a validated rating scale for our own evaluation tool.

Next version

  1. Clearer visual instructions
  2. First-time vs. regular users
  3. Prompts that draw out detail
  4. Defined score bands / validated scale
  5. Sub-scores that show what to fix
  6. Simulator or closed-course driving tests, for realism without road risk

Let's talk about what people feel in the spaces you're building.

smattson1229@gmail.com LinkedIn ResearchGate CV

Sofia E. Mattson · M.S. Human-Environment Relations, Cornell University · Ithaca, New York

{{ lbCap }}

{{ lbCap }}